
Our ongoing tracking of the latest case numbers of 2019-nCoV in Hubei, elsewhere in China, and around the world has revealed that the growth rate of confirmed cases is dropping, and in many areas appears to have dropped below the unconstrained growth rate in recent days.
While these latest developments do not mean we can say that R has dropped below replacement (the condition necessary to suggest containment of the epidemic), this can definitely be counted as a bit of good news — a hopeful trend, if it holds over the next week.
Our 2019-nCoV growth plots and how they work
This analysis extends our first post tracking case numbers from many locations on February 1, and our midweek update.
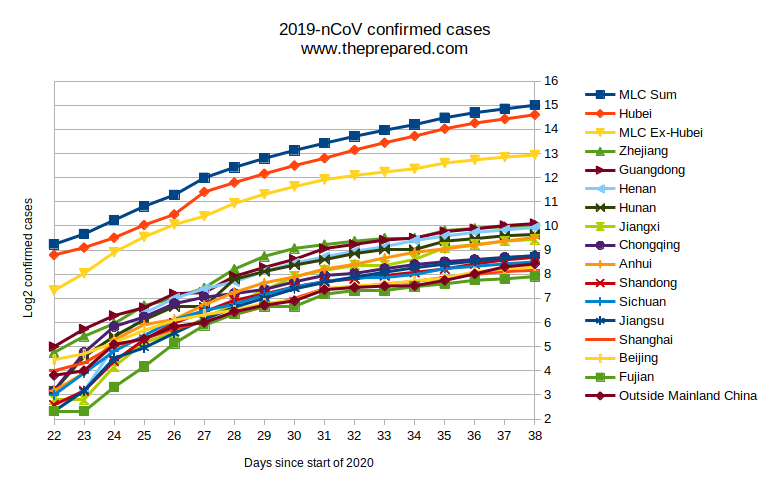
We’re using the same methods: tracking the number of cases each day in Hubei, the 13 most affected provinces outside Hubei, and the world outside China considered as a group, and monitoring the rates of growth over time.
We present the same two plots: a log plot of case numbers by location, and a growth rate plot over time. The growth rate plot has been changed to show only values from 0% to 40% (the highest sustained growth rate from Wuhan) to better zoom in on the relevant area, and we’ve implemented two day smoothing of the results to make the graph easier to read.
For reference, remember that 10% is the consensus academic estimate of the approximate rate of growth of a 2019-nCoV epidemic in the absence of any special control measures, so that a sustained fall below this number should indicate the quarantine is effective to some extent.
A sustained drop in the growth rate to closer to zero, followed by the recovery of most cases, will be an indication that actual resolution of the epidemic in a given area is likely.
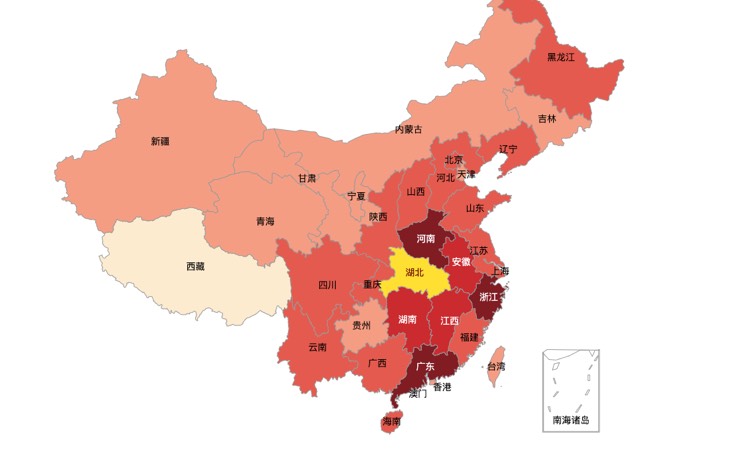
The latest figures from around the world
| Province/State | Feb 8 10 pm | Feb 7 8 AM | Feb 5 11 pm | Feb 4 10 pm | Feb 3 9 pm | Feb 2 9 pm | Feb 1 11 pm | Feb 1 10 am | Jan 30 930pm | Jan 29 9pm | Jan 28 11pm | Jan 27 830 PM | Jan 26 11pm | Jan 25 10 pm | Jan24 1159 pm | Jan 23 1159 pm | Jan 22 1200 pm |
| MLC Sum | 32798 | 29515 | 26485 | 22907 | 18806 | 16003 | 13441 | 11024 | 8976 | 7136 | 5507 | 4068 | 2488 | 1800 | 1209 | 811 | 604 |
| Hubei | 24953 | 22112 | 19665 | 16678 | 13522 | 11177 | 9074 | 7153 | 5806 | 4586 | 3554 | 2714 | 1423 | 1052 | 729 | 549 | 444 |
| MLC Ex-Hubei | 7845 | 7403 | 6820 | 6229 | 5284 | 4826 | 4367 | 3871 | 3170 | 2550 | 1953 | 1354 | 1065 | 748 | 480 | 262 | 160 |
| Zhejiang | 1048 | 1006 | 954 | 895 | 724 | 724 | 661 | 599 | 537 | 428 | 296 | 173 | 128 | 104 | 62 | 43 | 27 |
| Guangdong | 1095 | 1034 | 944 | 870 | 725 | 683 | 604 | 535 | 393 | 311 | 241 | 151 | 146 | 98 | 78 | 53 | 32 |
| Henan | 981 | 914 | 851 | 764 | 675 | 566 | 493 | 422 | 352 | 278 | 206 | 168 | 128 | 83 | 32 | 9 | 5 |
| Hunan | 803 | 772 | 711 | 661 | 521 | 521 | 463 | 389 | 332 | 277 | 221 | 100 | 100 | 69 | 43 | 24 | 9 |
| Jiangxi | 698 | 661 | 600 | 548 | 391 | 333 | 333 | 286 | 240 | 162 | 109 | 72 | 48 | 36 | 18 | 7 | 7 |
| Chongqing | 428 | 415 | 389 | 366 | 337 | 300 | 262 | 247 | 206 | 165 | 147 | 132 | 110 | 75 | 57 | 27 | 9 |
| Anhui | 733 | 665 | 591 | 530 | 480 | 408 | 340 | 297 | 237 | 200 | 152 | 106 | 70 | 60 | 39 | 15 | 9 |
| Shandong | 416 | 386 | 343 | 298 | 270 | 246 | 225 | 206 | 178 | 145 | 121 | 87 | 63 | 39 | 21 | 9 | 6 |
| Sichuan | 364 | 344 | 321 | 301 | 254 | 231 | 231 | 207 | 177 | 142 | 108 | 90 | 69 | 44 | 28 | 15 | 8 |
| Jiangsu | 439 | 408 | 373 | 341 | 308 | 271 | 236 | 202 | 168 | 129 | 99 | 70 | 47 | 31 | 23 | 9 | 5 |
| Shanghai | 286 | 277 | 254 | 233 | 208 | 193 | 177 | 169 | 128 | 101 | 80 | 66 | 53 | 40 | 33 | 20 | 16 |
| Beijing | 315 | 297 | 274 | 228 | 212 | 191 | 183 | 168 | 121 | 111 | 91 | 80 | 68 | 51 | 36 | 26 | 22 |
| Fujian | 239 | 224 | 215 | 194 | 179 | 159 | 159 | 144 | 101 | 101 | 82 | 59 | 35 | 18 | 10 | 5 | 5 |
| Outside Mainland China | 343 | 317 | 258 | 214 | 184 | 182 | 175 | 164 | 119 | 105 | 87 | 64 | 57 | 40 | 34 | 16 | 14 |
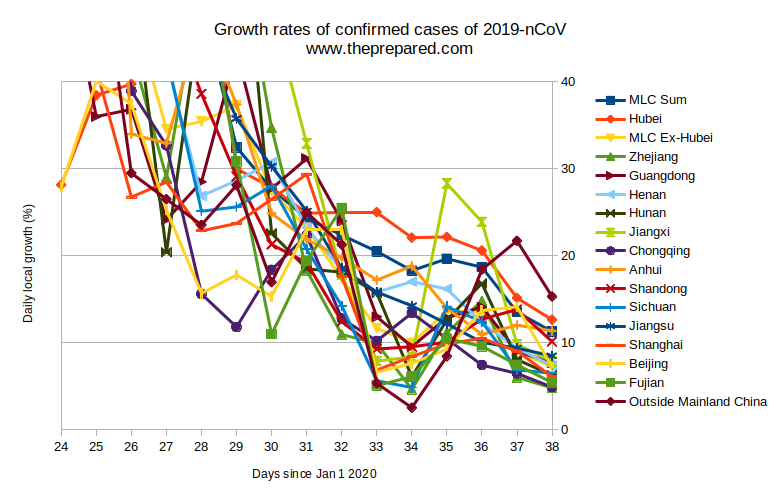
Growth rates still higher in Hubei, but falling everywhere
In Hubei, the rate of growth continues to fall, with the last two days of data showing only 13% growth per day. This is still very high, higher than the unconstrained rate of growth, but it is a significant decline in the growth rate from even a few days ago. If the growth rate continues falling, we should be able to declare that unless the ascertainment rate is actually falling, the quarantine is having a significant effect.
Elsewhere in China, this appears to have already happened. The rate of growth of the epidemic in official statistics has fallen below 10% for several days in a row in most of the 13 most affected provinces outside Hubei, and in ex-Hubei China in the aggregate, with Anhui and Shandong among the only provinces to see growth above the unconstrained rate in recent days.
Note: Recent revelations about the high false negative rate of Chinese PCR tests, including areas outside Hubei, have given us yet another reason to be skeptical about the specific numbers presented in official statistics. However, this decline in growth rates should be accurate unless the divergence between official numbers and true case numbers has actually been growing in percentage terms over time (i.e. ascertainment rate is dropping), which is the opposite of what epidemiologists expect in an outbreak.
One factor that could potentially interrupt this positive trend is the travel period of people returning from their extended new year holiday this weekend, and a partial return to work for Chinese employees on Monday. It’s unclear how this will affect the trends, and we may not know for up to two weeks after Monday due to the long delay between new infections and reporting.
Epidemic growth outside China may be slowing, but the Diamond Princess is a dark spot
Outside China, the growth rate had fallen below the 10% number as early as February 2, but surged above 10% again with the recent news of a colossal 63 cases onboard the cruise ship Diamond Princess, now anchored and quarantined off Japan. This incident, probably driven by a superspreader, has thrown ex-China case numbers off trend all by itself. However, it may be useful to consider the rest of the world without this incident, since it is still driven by direct spread from China and appears likely to be contained.
Excluding this incident, global ex-China growth has ticked up from its lowest values in the first few days of February, and sits at 9% per day over the last three days of reported data. While it’s still far from certain that global containment and eradication willl happen, the fact that case growth has remained below the 10% figure is encouraging.
The WHO’s daily sitrep for February 8 shows a more detailed view, breaking down cases outside China by their date of reporting and date of symptom onset. It also shows an encouraging view, with onset numbers dropping off in the last week and the growth in cases still substantially driven by those with travel history. Except, of course, for the Diamond Princess.
Overall, this is great news. If this kind of progress can be sustained, especially outside China where we have some more confidence in the ascertainment rate, then 2019-nCoV may yet be brought under control and exterminated.