With nine days now having passed since the initial Wuhan lockdown went into full effect, we’ve arrived at the earliest date that any positive results from that drastic measure could be reflected in the case numbers.
Any changes in the actual growth rate of the epidemic due to quarantines, travel restrictions, and the like will begin showing up in the case numbers only after a delay of approximately the virus’s incubation period, which is currently estimated at an average of between 4 and 10 days. But as we enter the latter part of that time window for the Wuhan lockdown, however, any good news is still hard to spot in the data.
We’ve run the numbers and generated a pair of plots that indicate that health authorities are still uncovering more of the already existing cases (i.e. “ascertainment” is still rising), but we can’t yet tell whether the quarantine measures are working to stop the virus’s spread.
Background: The “ascertainment rate” is the percentage of already existing cases that doctors are aware of and have recorded in the official case count. So part of the work of figuring out how fast the virus is spreading, is in separating out the number of newly confirmed cases that are the result of actual growth in the number of person-to-person transmissions from the number of newly confirmed cases that are the result of doctors just finding a larger percentage of infections than they previously did.
Crunching the Wuhan virus case numbers
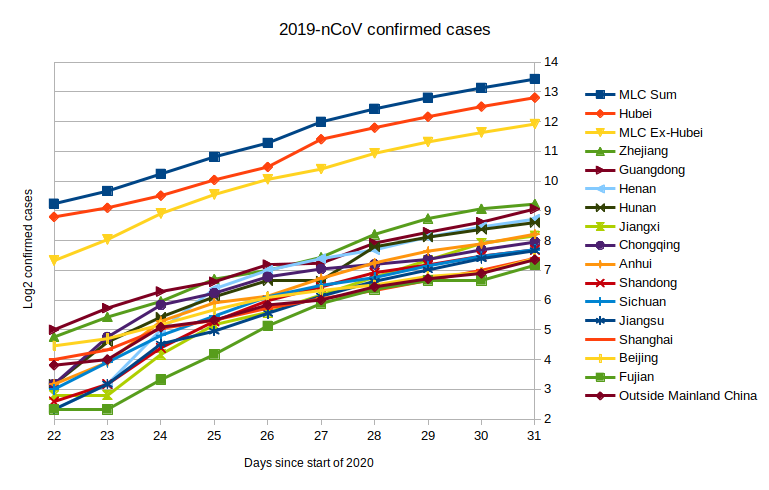
We plotted the confirmed case numbers from the Johns Hopkins University portal each day since January 22, as of the time the Chinese health ministry’s detailed case information was first released on the JHU portal. We separately tracked Hubei, the thirteen other Chinese provinces with large case numbers, the total number of cases outside mainland China, and the total for mainland China and for mainland China ex-Hubei.
The first of our two resulting plots shows the logarithm of the number of confirmed cases each day for each region.
(The case number plot above uses a logarithmic scale, i.e. 10 means 2^10, which is 1024, and 12 means 2^12, which is 4096. Logarithmic scales are useful for this kind of thing, because they turn exponential growth into a straight line, more easily allowing the visualization of exponential trends over a wider range of scales.)
The growth in confirmed case numbers shown in this first plot reflects a combination of two different effects:
- The actual growth of the epidemic
- Changes in the ascertainment rate
If the ascertainment rate were held constant, then any slowing of the growth in the epidemic would show up as a decrease in the slope of the logarithm plot. We’re seeing a modest decrease right now, but it’s hard to know whether that reflects an actual reduction in growth rate, or a reduction in how fast the ascertainment rate is growing. All the experts we’ve heard from agree that the ascertainment rate is still growing, but that growth may have slowed down.
Ascertainment has tended to increase rapidly over the course of the epidemic, and is probably higher outside China than inside, and higher in other parts of China than in Hubei itself. So it’s certainly not out of the question that a growth in ascertainment, much of it inside China, is increasing the case count and making it much harder to see any positive impact of the containment measures.
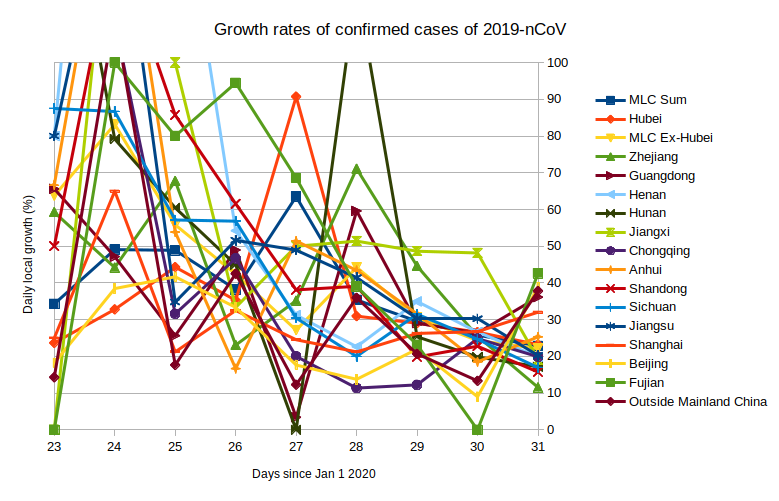
The second plot, below, shows the growth rate (in percent) from the prior day, for each region.
The best available estimate of the epidemic’s natural doubling time in the absence of control measures is 7.4 days, from a cohort study recently published in the New England Journal of Medicine. This would corresponding to a daily growth rate of about 10%, but you can see from the chart that most of the recorded growth rates are still well above that number.
Early in the epidemic, the number of confirmed cases was doubling about every two days, corresponding to a daily growth rate of about 40%. This very large initial daily growth rate is due to the way the actual growth and ascertainment happened to combine during this period.
The very large early growth rate numbers in individual Chinese cities were largely the result of cases being imported from Hubei, not organic growth, while in recent days the growth there has begun to reflect events in those cities themselves (i.e. viral spread and quarantine measures, and changes in local ascertainment).
Right now, it’s clear that the growth rate in reported cases in China has slowed, from about 40% to more like 20%. However, it is unclear if this reflects changes in the actual growth rate, the rate of increase of ascertainment, or both.
It’s definitely possible that about three quarters of the growth in the daily case numbers is coming from ascertainment changes, not real growth, as some experts have told us. But we just don’t know, yet.
The bottom line: no definitive good news, yet
The current growth figures we’ve plotted above could be explained by one of three scenarios:
- The epidemic’s spread has completely stopped, while ascertainment is growing at two thirds of its prior value.
- The epidemic is spreading completely unchecked, while ascertainment growth has shrunk by two thirds.
- Anything between scenarios 1 and 2 above.
Ultimately, then, we can tell that ascertainment growth is slowing, but we can’t yet tell if the quarantine has been effective at all.
We’re similarly in the dark when it comes to the growth in the number of cases outside China, which are being tracked much more intensively.
We only know of a handful of cases of transmission outside China, but it will be a while yet until we know whether the virus will really begin to spread in the rest of places it has emerged, and whether international travel precautions have significantly reduced the number of new cases arriving from China.
So, at the earliest juncture when the situation could have been clearer, it is not really clearer.


