

On Monday, the CDC released an early report on the “timing of community mitigation” to slow the spread of COVID-19. The study covered four metropolitan areas—Seattle, San Francisco, New York City, and New Orleans—between February 26 and April 1. The major takeaways:
- We know that social distancing, cleaning and disinfection, and protective measures like fabric masks can slow the spread of viral infections during a pandemic.
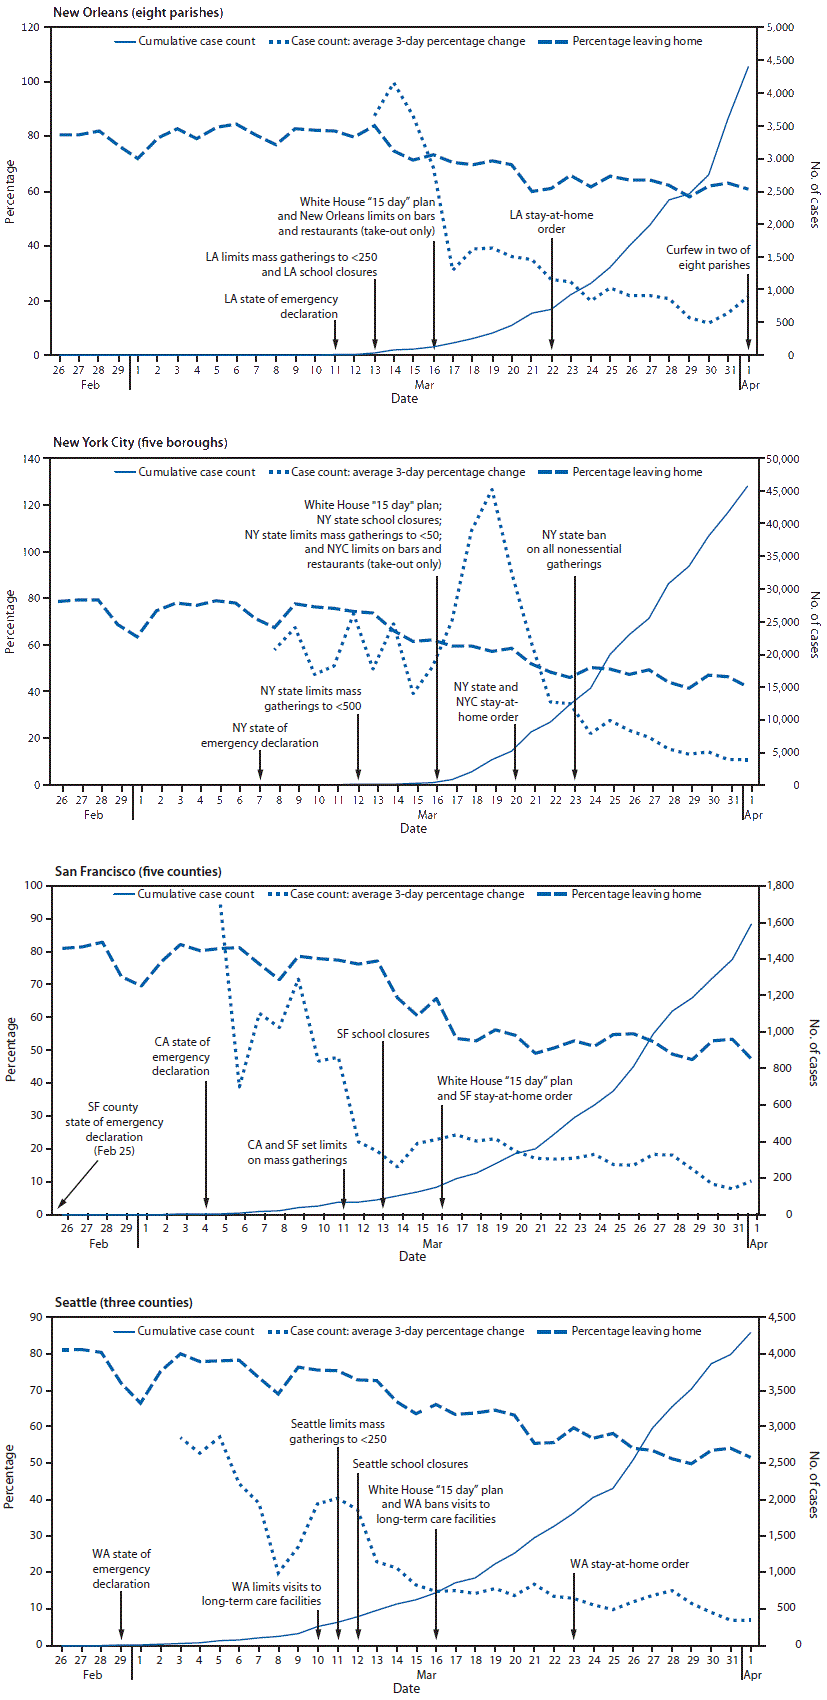
- During the time studied in those four cities, movement slowed down as local governments introduced health and safety policies and as COVID-19 cases shot up.
- It’s possible that policies to encourage stay-at-home policies actually work to keep people at home. But we can’t say for sure that slows the spread of the disease.
Analysis, please
The report found that people didn’t stay home substantially more when a state of emergency was declared in their state. It took limits on mass gatherings, school closures, and other policies to slow movement. As the White House introduced its 30 Days to Slow the Spread program, mobility decreased further. And it slowed down more when each state put stay-at-home orders into effect. So while 80% of people were leaving home on February 26, that number was closer to a 50% average in all states by April 1.
What’s unclear is whether or not those changes really helped slow the spread. In all four cities, the cumulative case count continued to rise, even as mobility decreased. In the graphs released by the CDC, mobility is a line pointing slightly downward, while cumulative case count shoots upward. Meanwhile, the average 3-day percent change in cases hops around before slowly decreasing.
Here’s how we might interpret the data. First of all, it seems to have taken multiple combined public health policies to successfully get a majority of Americans in these four cities to stay home. In the meantime, the long incubation period for COVID-19 means cases spread undetected and then skyrocket when people start to show symptoms and get tested.
Eventually, stay-at-home policies seem to work. Health officials took averages of the percent change in cases every three days. That change in cases seems to drop over time, even as the cumulative count continues to rise in what looks like a very dramatic fashion.
This is what a community mitigation policy looks like
The CDC based its report on publicly available cell phone location data, aggregated and anonymized by a company called SafeGraph. During the coronavirus pandemic, SafeGraph has compiled data on devices that move more than 150 meters from their “common nighttime locations.” In other words, if you keep your phone on your bedside table at night and then your phone travels 150 meters from your bed during the day, they assume you’ve left the house and aren’t “sheltering in place.”
The CDC recommends mitigation policies like posing limits on social gatherings, closing schools, restricting business operations, and imposing shelter-in-place orders. For now, though, the data on how much those policies impact the actual spread of cases is pretty limited. That’s because the numbers indicate a relationship between cases and public policy, but researchers can’t yet prove causality. We also still don’t know how many people have COVID-19 overall, as access to testing is limited.
It’s also possible that people move differently in Seattle, San Francisco, New York, and New Orleans than they do in rural Alabama, Wyoming, or Minnesota.
You are reporting the comment """ by on