

ICUs in some areas of the United States are about to go into overflow mode, as you’ve probably seen. You may have even shared a story about this on a social media site. And if you shared one of those “ICU occupancy is surging” stories, odds are good that someone responded to by suggesting that you calm down and do a bit of simple math: Current number of occupied ICU beds / Total population in the area = Teeny tiny numbers.
Take Houston, TX, for instance — an emerging hotspot not far from where I live. Houston has a population of 2 million people, and the Texas Medical Center website that publishes stats on ICU occupancy shows that currently 1,298 of those beds are occupied. 1,298 people in ICU divided by 2 million Houstonians means only 0.07 percent of the population of Houston is currently in the ICU — a really small fraction of the population. Doesn’t seem so bad, does it?
This simple ratio is accurate as far as it goes — but the problem is that just doesn’t go very far. You can’t use this kind of math to reason about healthcare capacity issues in an evolving pandemic, because it contains a really subtle error. This error is a classic one that’s familiar to economists: mistaking stocks for flows.
The bottom line: Charts and dashboards tend to measure ICU capacity in beds, but the far more important number for estimating healthcare system load is bed-hours, i.e. a bed occupied for a stretch of time. If you think solely in terms of beds divided by population, and not in terms of bend-hours divided by evolving bed-hour demand, then you will:
- drastically overestimate the number of ICU beds needed to handle the pandemic, and…
- drastically underestimate the prevalence of COVID-19 in a given area because the bed occupancy levels appear far lower than you (wrongly) think they’d be if the virus were rapidly spreading.
Walking through the math on ICU beds
Before I show you the correct math, I first want to show you the wrong math. The difference between these two will help you understand how and why so many people (many of them quite smart) get this as wrong as they do.
The bad math
Let’s imagine that Houston ultimately sees 20 percent of its population infected with SARS-CoV-2 (i.e. an “attack rate” of 20 percent). That’s 400,000 cases over the course of the pandemic, and would represent approximately the level of COVID-19 burden which New York has already experienced.
Now, let’s assume that 4 percent of those cases will need an ICU bed — that’s a little on the low side, but it’s reasonable. Using the naive math outlined above, that comes out to 16,000 ICU beds needed. But the Houston area has a maximum surge capacity of just 2,000 ICU beds*. What a massive shortfall!
(*Note: These 2,000 ICU beds are the Texas Medical Center system, which isn’t quite the whole of Houston’s bed capacity. But it’s not far off, and is useful enough for our purposes in doing some quick math.)
We’ll run out in Houston, right? Not necessarily. All 16,000 of those cases won’t rush the ICU at once. They’ll be spread out, with each case needing one of those 2,000 ICU bed for a limited number of hours.
The better math
If you model ICU load in bed-hours, and you estimate that the average patient spends about 10 days (240 hours), then you need an average of 240 ICU bed-hours to treat a single patient. So our 16,000 critically ill Houstonians will need a grand total of 3,840,000 ICU bed-hours to get us through this epidemic.
To make the numbers nice and round, but still very much in the ballpark of reality, let’s say that the Houston hospital system can comfortably handle 1,600 full ICU beds per day indefinitely. So every single day, those 1,600 beds have 38,400 ICU bed-hours available (e.g., 24 hours x 1,600 beds).
If that’s true, it will take the Houston system 100 days to match each available bed-hour with the 3,840,000 ICU bed-hours needed to fully fight off the pandemic in our model scenario.
Think about what this (still overly) simplified scenario means for our intuitions about ICU bed counts: if you can stretch out the outbreak perfectly evenly over 100 days, then all you need are 1,600 ICU beds to fight off a pandemic that infects 20 percent of Houston and puts 4 percent of its victims in the hospital. Just 1,600 ICU beds for a population of 2 million!
If you want to use this math to ballpark how many continuously occupied ICU beds you’d need to flatten the curve in your region over the course of a given period, here’s the equation: Population x Attack rate x ICU rate x ICU length of stay (days) / Length of outbreak (days) = Number of ICU beds
Of course, even though I’ve nuanced it well beyond a simple beds/population division exercise, my scenario is actually still too simple. It doesn’t take account of the way that cases grow on a curve, so demand will undershoot the 34,800 bed-hours of ICU capacity for some number of days during the 100-day period, and then overshoot it significantly during a smaller number of days.
But despite the fact that my model overcorrects in a more optimistic direction (its simplifying assumptions make ICU needs look lower than they should be), it’s still useful for making the simple point that when you measure hospital capacity in bed-hours (and not just beds), you end up with far more real-world capacity in the face of a growing contagion than simple “current beds divided by population” math would suggest.
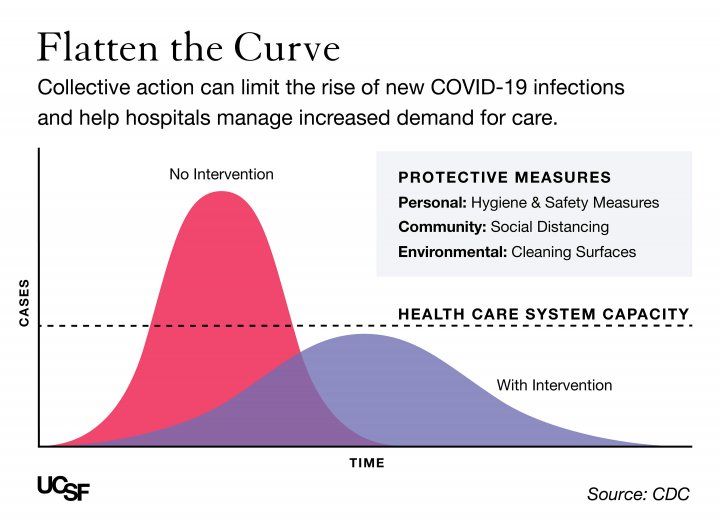
All of the above, of course, is what “flattening the curve” is about. The only thing I’ve really done with this discussion is to point out that the “healthcare system capacity” lines on the famous “flatten the curve” graphs shouldn’t be thought of as “hospital beds” but rather “hospital bed-hours”. In fact, the entire y-axis should really be “hospital bed-hours” and not “cases.” That one change in units from “beds” to “bed-hours” is a change from a “stock” to a “flow”, and that makes all the difference.
The details matter
All of this nuancing about stocks vs. flows and beds vs. bed-hours probably smells to many people like I’m trying to cloud the issue. For a certain kind of thinker who has made a successful career out of sticking with simplifying heuristics, all of the twists I’m introducing here will pattern-match as “lying with statistics.”
But I’m not lying, and you really do have to spend some time in the mathematical weeds before you can develop the kinds of numerical intuitions that will let you make simplifying assumptions that are actually useful for the present situation. If you just jump straight to the heuristics without first developing a nuanced understanding of the underlying system, then you end up with GIGO.
I am seeing a lot of this kind of COVID hospital capacity GIGO happening in finance and investing circles. These folks were correct early on about the pandemic because they were practiced at doing math with exponentials, and they had developed a set of numerical intuitions around viral spread that caused them to sound the alarm far earlier than more linear (or “base rate”) thinkers.
But now is the time move from a simple exponential growth mindset to a mindset that thinks in stocks and flows. Your charts and social media posts must understand a hospital bed not as a fixed resource that’s consumed by a patient, but as a productive asset that creates a regular supply of “bed-hours” — it’s this constantly produced “bed-hour” supply, and not the bed itself, that actually being consumed by COVID patients.
When you shift your mindset to thinking in terms of ICU bed-hours in a specific geography, then you’ll have a much better sense of how the ICU bed occupancy numbers relate to the virus’s growth in that area, and to the larger questions of disease prevalence and personal risk for everyone who lives there.
Knowing the right way to think about ICU occupancy rates will keep you from mistaking a low fraction of the population in ICU for an “all-clear” signal. You’ll be better equipped to gauge how much trouble our region is or isn’t in as the numbers tick up.
The wages of ICU overload: excess mortality
It’s important to understand that ICU overload has ripple effects far beyond COVID-19. When the ICUs are jammed up with COVID patients, people who need those beds for car accidents, heart attacks, strokes, and other emergencies won’t get them, and will die.
So an area reaches the point of ICU overwhelm, the “all-cause mortality” numbers will quickly begin to ramp up far beyond the COVID-19 mortality numbers. All of that extra death is known as “excess mortality”, and in areas that have seen the healthcare system overloaded it often comes in at 5 to 6 times COVID-19 mortality.
Furthermore, because COVID-19 ICU patients are often staying for 10 days or longer, and because the demand for bed-hours keeps rising with the case count for long after we’ve reached the saturation point, when we cross that capacity limit we’re just at the beginning of the ugliness.
Just remember when #ICUs are at capacity you have WEEKS of #COVID19 badness ahead of you- even when you lock everyone down.
We are headed in a disasterous direction.
— Dara Kass, MD (@darakass) June 24, 2020
Terrifying warning from Mississippi's top health official of "an absolute disaster" this fall:
"Prepare for not being able to get into the hospital if you have a car wreck, (to) have a heart attack and there not be a ventilator to put you on." #COVID19 https://t.co/tqnVfsxz4n
— Ashton Pittman (@ashtonpittman) June 24, 2020
So with many regions approaching the ICU capacity limit, our advice is to buckle up — literally. Actually, even better than buckling up is to just quit driving entirely, because if you get in a bad car accident, there may be no place for an ambulance to take you.
You are reporting the comment """ by on