Share your knowledge & learn from experts
Because prepping and community go hand in hand
News for the week of 2024-04-08
Make a top-level comment for a new story/topic. Discussions about the topic should be in the replies to the top-level comment. That way things stay organized and every main comment as you scroll down is a different piece of news.
Read MoreNews for the week of 2024-04-01
Make a top-level comment for a new story/topic. Discussions about the topic should be in the replies to the top-level comment. That way things stay organized and every main comment as you scroll down is a different piece of news.
Read MoreNews for the week of 2024-03-25
Make a top-level comment for a new story/topic. Discussions about the topic should be in the replies to the top-level comment. That way things stay organized and every main comment as you scroll down is a different piece of news.
Read MoreNews for the week of 2024-03-18
Make a top-level comment for a new story/topic. Discussions about the topic should be in the replies to the top-level comment. That way things stay organized and every main comment as you scroll down is a different piece of news.
Read MoreNews for the week of 2024-03-11
Make a top-level comment for a new story/topic. Discussions about the topic should be in the replies to the top-level comment. That way things stay organized and every main comment as you scroll down is a different piece of news.
Read MoreRecap from the 2024 SHOT Show
This is a casual overview of what I noticed/liked a few weeks ago at SHOT Show. If you’re not familiar, SHOT is the biggest annual trade show (2,500 exhibitors, 1M square feet) for the firearm industry, with secondary focuses on military/LE, survival, hunting, camping, etc.
Summary:
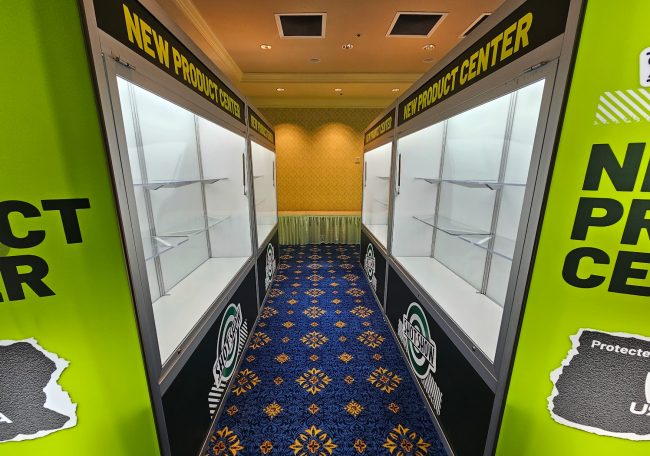
There aren’t big or important things to point out, and I didn’t see anything I think is a must-buy. The industry has been in a cycle the last few years where it’s less about big (r)evolutions and more about iterations. Some other experts/influencers complained it was a weak show year. The few trends I did notice and like are the attention on thermal optics, finally moving to USB-C as standard for electronics, better threat labeling on body armor, lots of drones, and a focus on respirators. For example, the makers of my personal BOB headlamp, Armytek, are finally moving to USB-C charging (instead of their proprietary magnetic cable) later this year. The marketing pitches for most new products were centered around customization/personalization, comfort, using different materials and manufacturing methods (eg. 3D printing and self-healing waterproof zippers), and filling in the niche use-cap gaps with lots of permutations. Retro/throwback gun designs, lever actions, old M4-style carry handles, and ‘modular’ platforms meant for swapping to different calibers were the main trends. None of which I like or think are appropriate for preppers. I got to shoot the new 8.6 Blackout caliber via the new Q Boombox. The 8.6 round is a spiritual successor/compliment to the 300 Blackout round, and the Boombox is the successor to the Honey Badger. I really liked both and will probably lean into them as a core part of my firearm mix — but broad adoption of the 8.6 might take a few years. The industry still has a problem with focusing on proprietary parts and manufacturer lock-in. And the industry still sucks at communicating with and selling to the general public.Empty “New Product Center” shelves, showing how there wasn’t a lot of distinctly-new stuff.
Geopolitics are noticeable. Putting this up front since it’s of broad “what’s going on in the world” interest. I couldn’t help but notice an increase in attendees from NATO and similar countries that have a renewed interest in national defense — countries like Poland, Finland, Lithuania, Taiwan, and Vietnam that have good reason to fear Winnie the Pooh and his pink-faced sidekick Piglet. Turkey had a lot (dozens?) of manufacturers present, trying to sell cheaper but still Western-acceptable knockoffs. The Chinese manufacturers are still there promoting their IP-theft knockoffs, but it was less than previous years.
Thermal optics (and ways to stay hidden from thermal optics) are getting the attention they deserve. One of the big lessons from the Russian invasion of Ukraine, for example, is just how much thermal makes a difference in the field. Which also matters to you in a home defense or hunting situation. The tech has always been prohibitively expensive in the past (eg. I got to play with a $85,000 military unit) but we’re hitting the “J curve” in the tech and prices are starting to become reasonable for civilians without sacrificing usefulness. We’ll probably soon be at the point where traditional “night vision” is no longer worth it. Very excited to watch this space over the next years. Holosun and Pulsar are examples of brands to watch here.
For example, I got to use a ~$3,000 Thales prototype (first two pictures below) that mostly functions like a typical EOTech-style rifle optic while it real-time overlays a silhouette around warm targets. So you can easily spot a person hiding in your woods, or a predator you’re trying to keep away from your livestock, etc.
Note the faint yellow box in the middle 50% of the view, outlining warm targets inside, while the guys around the periphery aren’t highlighted.
Example of a typical military thermal, placed in front of a normal rifle scope.
Saw a growing number of these products that attach to an NVG monocular, projecting thermal/other info over top (the little nub protruding from the bottom unit over the big glass of the monocular). Seems very impractical and heavy, though.
Respiratory protection is a logical market focus in the post-Covid years. Especially among the military and law enforcement brands, there were many new products and marketing pitches about making respirators easier to use — such as focusing on reducing weight and neck fatigue, making it easier to get a cheek weld on a rifle while wearing a mask, more powered (PAPR) units that move the filter canisters to your body (connected to mask via hose), etc.
Got to spend time with our friends at MIRA Safety, who were promoting their new CM-8M full face respirator and smaller options for kids and dogs, along with an optional powered PAPR unit that mounts to your pack/plate carrier. The 8M looked good enough (especially for the $325 price) that I plan on buying one, including the PAPR (another $400), and could see it becoming the main full-face respirator in our personal kits.
3M promoted their new one-finger Secure Click feature on half- and full-face respirators, which makes it easier and more sanitary to verify you have an airtight seal against your face. Traditionally, to conduct a seal check you have to use both hands to block the canisters/cartridges that bring air in.
Body armor is maturing nicely, with better threat labeling and a recent focus on ballistic helmets and even ballistic eye protection. One of the things I really harped on when writing the web’s first ‘consumer friendly’ guides on body armor was the lack of marketing transparency about what specific ammo would be defeated — partly because the government standards (eg. Level 3, Level 4) are very outdated and didn’t match the reality of the technology progress. Things are getting better in this regard, and I noticed many more manufacturers printing the specific calibers on the back side of the plate. So you can quickly know if a piece of armor could stop the common “armor penetrating” rounds like M855A1, for example. But the government needs to update their standards so that commercial marketing wankers stop using cutesy meaningless labels like “Level Super 3+X” or “Level 3+++ STR”.
The market for helmets (whether ‘armored’ or just bump helmets / mounting platforms) is maturing, with lots of needed advancements in accessories, comfort, ability to run power cables in a way that’s secure but easy to undo, etc. 3M promoted a new design that makes it much easier/quicker to change your ear headset/comms between helmet mounted and strap mounted — a no-brainer design that should’ve existed years ago.
I’ve never recommended armored “ballistic” helmets (typically Level 3A) in the past because they were too heavy, costly, niche, etc. to be worthwhile for civilians. But as materials sciences and manufacturing improve, it seems like we’re starting to cross the line into worthwhile as I noticed more companies prototyping in this space. Example from Team Wendy:
Modularity continues to be a trend, and I continue to dislike it. It sounds great in theory: you buy “one gun” (the serialized part regulated by the government) and swap out different parts so that one gun can fire 9mm, 5.56, 7.62, 300 BLK, and so on. There’s a lot to like about that idea from a prepping perspective. But I’ve yet to see it done well enough that it’s worth it in almost any product category (not just guns) — you end up with something that’s sorta fine at lots of things but not better than a standalone product for a specific thing. And they tend to break more often, have proprietary parts, etc. It’s the same reason why we dislike other survival tools that try to do too much, like a “32-in-1” axe that also has a compass, knife, bottle opener, allen wrench, toothpick, etc.
A good example at this year’s show is from Primary Weapons Systems — a company I’ve liked for a long time, and I own multiple of their piston rifles for >10 years. Their big launch this year is the modular UXR rifle. But I got to shoot it… and it did not change my mind on this issue.
The new 8.6 Blackout round is promising, and I’ll probably buy the new Q Boombox + Porq Chop suppressor in 8.6. I’m generally a Q fan and already have their predecessor to the Boombox, the Honey Badger in 300 BLK + Trash Panda can. You can read more about the 8.6 round, but it’s a bigger/heavier bullet than the 300 with more effective range — sub-MOA at 300 meters, even when subsonic.
The round is still very new and expensive at >$3 a round! But it’s the early days, and I suspect the merits of the round’s performance + that it fills a use-case gap in the market + the tie-in with sexy hardware like the Boombox will make it a viable option for primary use in the future (rather than just a toy for gun nerds).
We got to fire the Boombox + Porq Chop in 8.6 and everyone in our group was honestly surprised by how much we liked it. One of the design changes from the Honey Badger is easier disassembly/reassembly — a much, much needed change, since the HB bolt can be tough to get back in place. The extra power compared to a 300 BLK is noticeable, but while still being a very light setup that doesn’t recoil much. The Boombox is not yet on market, but should be in a few months.
Review from TFB:
There’s finally a “turn a pistol into a PCC” chassis that I want to buy: the Flux Raider for Sig 365. This was broadly considered one of the more exciting new products at SHOT (eg. James Reeves picked it as the #1 PCC). With the stock folded, you can carry it in a waistband-concealable holster. And when you draw it from the holster, the stock auto opens for your shoulder / third point of contact. The mag release also releases the spare second mag (which acts as a vertical foregrip until needed) at the same time.
It’s not on the market yet, but will be within months. It honestly might become the primary weapon in my wife’s BOB, since it’s small and lightweight but still offers improved performance over just a pistol.
Deeper review from TFB:
3D printed suppressors are now a thing, more all-titanium options, and a focus on reducing gas blowback. I shot my first 3D printed suppressor and it was surprisingly nice. The pictured can was manufactured by PTR, and you can see a closeup of the material in the pictured logo below. While not 3D printed, SilencerCo released the titanium Spectre 9 that handles 9mm + 300 BLK in both super and sub — I might pick this up for my personal stash.
Many suppressor companies are talking about “vent through” designs that reduce blowback into the shooter’s face by deflecting gas forward and/or holding the gas in place for longer so it can dissipate — a much needed improvement in this market. No more tears!
Misc
Magpul released a translucent magazine (TMAG) — a product category that isn’t neccesarily new, but Magpul is known for better quality and testing, which matters in this case because the transparent-type mags are inherently weaker than their opaque versions. I also liked Omega’s magazines and the MagRipper speed loader.
Work Sharp, makers of some of our favorite blade sharpeners, released a new rolling knife sharpener. I didn’t get to use it enough to endorse it, but it’s intriguing and I definitely want to play with it.
I noticed manufacturers are paying more attention to better designs/options in medical packs, where they’re making it easier to see and label different pouches. I liked the pictured kit that had velcro across the grab handles for these clear, swappable labels:
Saw some focus on comfort improvements, whether in clothing, pack/load carrying, etc. Pictured is a pad worn between your chest and body armor plate that adds cushioning and airflow / sweat reduction:
I noticed more firearm manufacturers playing with bullpup designs. Although many of them still seem to have the issue where spent shells/casings are ejected downward onto your exposed inner wrist (which is the #1 reason I sold my Kel-Tec KSG bullpup shotgun).
Not sure why, but there was a noticeable increase in 40mm grenade launchers.
I did not notice much new in the Pistol Caliber Carbine (PCC) market. Seems like we’re in the maturation phase of this cycle, with higher-end groups like Daniel Defense starting to offer their own models, which are nice but not really revolutionary.
Variable optics, which you normally have to adjust/rotate by hand (which interrupts your firing, sight, etc.), now have a push-button powered option with the Scopeswitch from Antimatter Industries:
Darn Tough told me they have no plans to remove or reduce their legendary warranty even though they’ve started ramping up the “lifestyle” lines of socks meant for more casual use — which have thinner fabric than the more rugged traditional models and thus are more likely to wear out.
Watertight, self-healing zippers are being adopted by more designers. Yay. I hope the long-term durability tests turn out well and this becomes a new norm.
Small drones are a logical market focus given how effective they’ve been in the Ukrainian war. Nothing special to mention for our context, but I’d expect to see new advancements trickle down into the consumer market in the coming years.
And although not at all relevant for us normal folks, this $500,000 fully armored skid steer + breaching platform that attaches to the skid steer boom arm was really awesome. Imagine the police rolling up to a barricaded house with this bad boy:
Good SHOT recap videos from others, if you want to see more:
Read More
News for the week of 2024-02-26
Make a top-level comment for a new story/topic. Discussions about the topic should be in the replies to the top-level comment. That way things stay organized and every main comment as you scroll down is a different piece of news.
Read MoreNews for the week of 2024-02-19
Make a top-level comment for a new story/topic. Discussions about the topic should be in the replies to the top-level comment. That way things stay organized and every main comment as you scroll down is a different piece of news.
Read MoreNews for the week of 2024-02-12
News for the week of 2024-02-12
Read MoreNews for the Week 2024-02-05
Make a top-level comment for a new story/topic. Discussions about the topic should be in the replies to the top-level comment. That way things stay organized and every main comment as you scroll down is a different piece of news.
Read MoreNews for the week of 2024-01-29
Make a top-level comment for a new story/topic. Discussions about the topic should be in the replies to the top-level comment. That way things stay organized and every main comment as you scroll down is a different piece of news.
Read MoreNews for the week of 2024-01-22
Make a top-level comment for a new story/topic. Discussions about the topic should be in the replies to the top-level comment. That way things stay organized and every main comment as you scroll down is a different piece of news.
Read MoreNews for the week of 2024-01-15
Make a top-level comment for a new story/topic. Discussions about the topic should be in the replies to the top-level comment. That way things stay organized and every main comment as you scroll down is a different piece of news.
Read MoreNews for the week of 2023-12-31
Make a top-level comment for a new story/topic. Discussions about the topic should be in the replies to the top-level comment. That way things stay organized and every main comment as you scroll down is a different piece of news.
Read MoreNews for the Week 2023-12-25
Make a top-level comment for a new story/topic. Discussions about the topic should be in the replies to the top-level comment. That way things stay organized and every main comment as you scroll down is a different piece of news.
Read MoreNews for the Week 2023-12-11
Make a top-level comment for a new story/topic. Discussions about the topic should be in the replies to the top-level comment. That way things stay organized and every main comment as you scroll down is a different piece of news.
Read MoreNews for the week of 2024-12-04
Make a top-level comment for a new story/topic. Discussions about the topic should be in the replies to the top-level comment. That way things stay organized and every main comment as you scroll down is a different piece of news.
Read MoreNews for the week of 2023-11-27
Make a top-level comment for a new story/topic. Discussions about the topic should be in the replies to the top-level comment. That way things stay organized and every main comment as you scroll down is a different piece of news.
Read MoreNews for the Week 2023-11-20
Make a top-level comment for a new story/topic. Discussions about the topic should be in the replies to the top-level comment. That way things stay organized and every main comment as you scroll down is a different piece of news.
Read MoreFifth National Climate Assessment and Being Prepared
This week the Fifth National Climate Assessment (NCA5) was released. This report can help people prepare for changes coming to their neighborhood. The report stated that at this point, every region of the United States is experiencing climate change. (https://nca2023.globalchange.gov/#overview)
I’m part of a team working to analyze the studies behind NCA5, and look for sound corroboration (or lack thereof) in its conclusions.
Our ultimate goal is to present the information in regular language to help people and communities get ready for what’s ahead in their part of the country.
Different kinds of disasters will hit different places. The NCA5 not only helps folks understand what kinds of serious events they can expect, but also how frequently those events are likely to take place.
It also presents a longer view. No matter where you live, your climate is actively changing. Here in Colorado, we are still enjoying the lovely blue-sky days of fall. It’s delightful until you look at the Front Range and see almost no snow on the high peaks. And it’s the middle of November.
The USDA reports that Michigan’s Upper Peninsula is changing to look like Virginia does now. (https://usfs.maps.arcgis.com/apps/MapSeries/index.html?appid=96088b1c086a4b39b3a75d0fd97a4c40)
So much of the time, prepping is about surviving an immediate catastrophe. Or it’s about some dystopian science fiction world.
As I study the NCA5, it dawns on me that preparation is about anticipating change. The change can be bad, or it might be good; in any case, things are different now, and change is continuing to accelerate. We must be able to grieve our losses and then turn to our different world and figure out what to do next. Preparation is always about flexibility, and sometimes, it’s about rolling with the punches.
Read MoreNews for the Week 2023-11-13
Make a top-level comment for a new story/topic. Discussions about the topic should be in the replies to the top-level comment. That way things stay organized and every main comment as you scroll down is a different piece of news.
Read MoreNews for the Week 2023-11-06
Make a top-level comment for a new story/topic. Discussions about the topic should be in the replies to the top-level comment. That way things stay organized and every main comment as you scroll down is a different piece of news.
Read MoreNews for the week of 2023-10-23
Make a top-level comment for a new story/topic. Discussions about the topic should be in the replies to the top-level comment. That way things stay organized and every main comment as you scroll down is a different piece of news.
Read MoreDYI Air Purifier for Wildfire Smoke
Facing the worst air quality in recorded history (and my air purifier temporarily inaccessible in storage) I built my own today using Eric’s COVID Air Defense System kit, also known as a Corsi-Rosenthal Cube. It works for wildfire smoke as well as for Covid.
I followed these instructions to build it: https://encycla.com/Corsi-Rosenthal_Cube
I was able to have the MERV 13 filters delivered the same day by Instacart so I didn’t have to leave my apartment.
Read More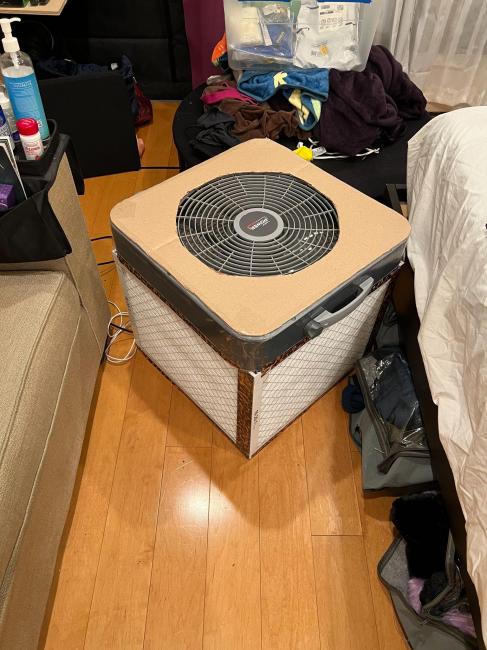
News for the Week 2023-10-30
Make a top-level comment for a new story/topic. Discussions about the topic should be in the replies to the top-level comment. That way things stay organized and every main comment as you scroll down is a different piece of news.
Read More