DIY custom maps for print & reference
TL;DR – it is possible to make custom print quality maps, in some cases very quickly (though your first try may not be quick!). That being said it is also possible to waste a lot of time and money making less usable or useless maps. The following is an attempt at quickly “getting started” for technically savvy but otherwise novice users.
Try at your own risk, for what its worth I probably added more detail than strictly needed, I’m not 100% sure how approachable this guide will be but its offered in good faith, your mileage may vary! Once you have this down its really only 4 [main] steps that can be done in less than half an hour unless you want to do something fancier.But first, what I’ll be showing: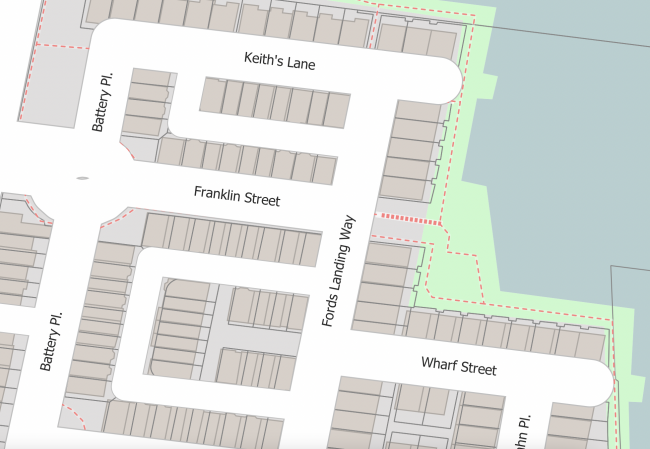
Above, a small “zoomed in” section of the final map as exported to a digital PDF file (the “misaligned” building/parcels are a data issue, not a software issue and acceptable for my purposes)
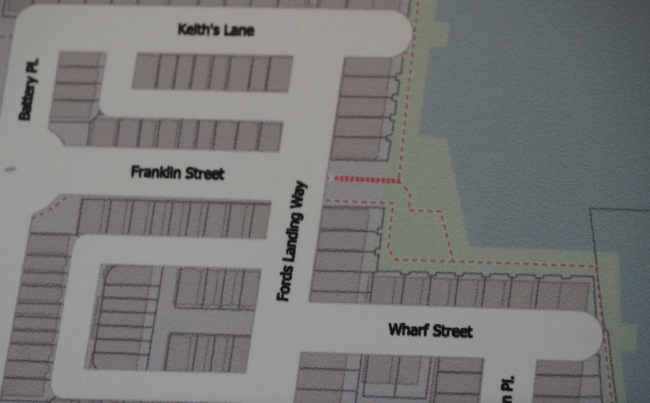 Roughly the same area on the printed poster for quality comparison ordered via Vistaprint (image darkness more a factor of my poor photography skills). Keep in mind this is less than a 5 inch wide segment zoomed in (it’s smaller than my iPhone 13 mini). The text quality is mildly disappointing compared to the original but otherwise this is actually pretty good quality IMHO, showing the ‘warts’ on purpose to be transparent.
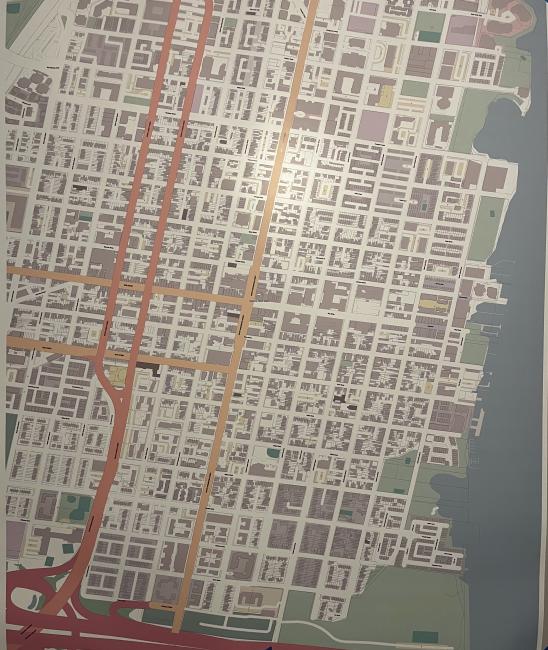 Above, a zoomed out view of a 36″x48″ poster sized map with the top/bottom cropped to hide my poor poster mounting skills (Again, I should have changed my photo settings, but photography is not the point of this post).To create your own version, in 5-7 somewhat “easy-ish” steps:
QGIS is an open source Geographic Information System (GIS) application. While this application is capable of a wide variety of tasks, one task it is suited for is the creation of maps for printing. This tutorial is a “simple” crash course in creating a custom map suitable for printing on either a home printer or a commercial service such as a Fedex-Kinkos or Vistaprint poster.
Note: Steps 4 & 5 are strictly optional, OpenStreetMap is often pretty good. Many sub-bullet points are FYI, assuming you leave default settings alone or don’t move/close something by accident this can go pretty fast.
Step 1: Download the application.
QGIS is available for most major operating systems, most users should be able to make use of an easy to use installer though advanced users may want to consider specialty options. Note that as an open source application this software is community driven and supported, including documentation and online help. The user interface may include subtle changes between versions which may result in slightly different workflows. This guide was written for version 3.20.3 on windows but should be broadly compatible with recent versions (users have the option to download older versions at their discretion).
Step 2: Open the application and add OpenStreetMap background layer
- Open the application and navigate to the File Menu, select “New”]
- Make sure that the “Browser” and “Layers Panel” panels are visible
- If needed these can be added by going to the “View” menu, select “Panels” and make sure “Layers Panel” and “Browser Panel” have checks next to them
- Note that the panel layout/position can vary and that some panels can have tabs. Panels can be reorganized by clicking and dragging them as desired.
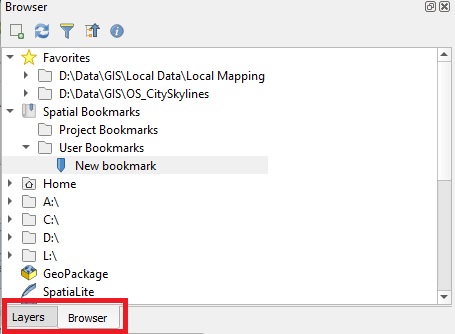
Above, an example of “tabbed” panels in case one is not immediately visible
- On the “Browser” panel, locate and expand the “XYZ Tiles” option, OpenStreetMap should be a preloaded option available. Double click this option to add it to the map.
- This should load a streaming map service (requires active internet connection) as a background reference layer
Step 3: Navigate to an area of interest
- QGIS includes a number of navigation tools such as pan and zoom, these should be displayed by default but if absent can be added by going to the “View” menu, selecting “Toolbars” and then making sure that “Map Navigation Toolbar” is selected
![]()
- Use the pan and zoom buttons to find an area of interest (Pan = first icon, click and drag with mouse, zoom controls are icons 3-10)
- If your mouse has a “middle mouse button” (oftentimes the “button” is your scroll wheel) you can “pan” while clicking and holding the middle mouse button. You can also scroll with the mouse wheel to zoom in and out. Equivalent trackpad gestures should also work.
- As you zoom in the streaming Open Street Map reference layer will add more details. Other data sources can be loaded however this is a useful “first step” in many cases.
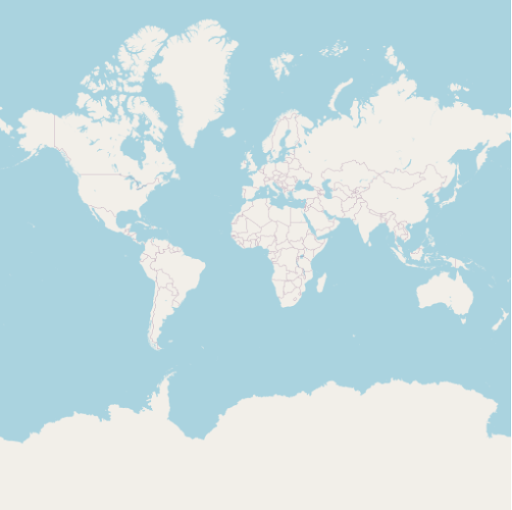
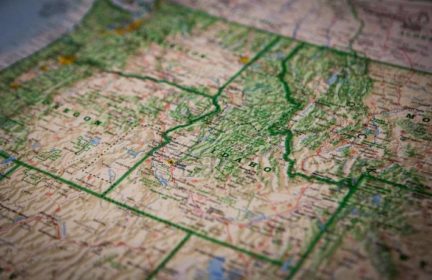
Above, global scale of OpenStreetMap Layer
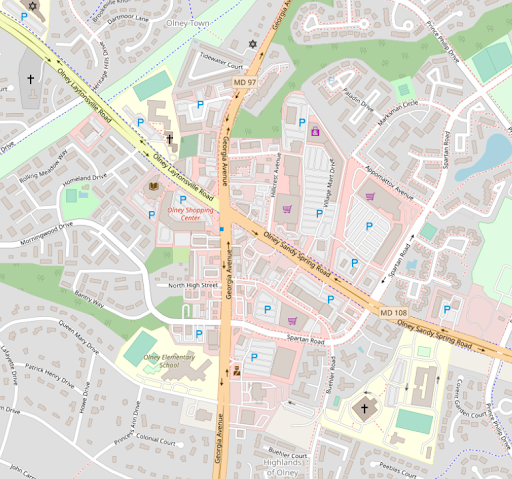
Above, zoomed in to the same layer with more detail automatically displayed.
Step 4: Add more data (optional)
Note: Steps 4 and 5 aren’t strictly needed if you’re happy with the OpenStreetMap details. Much more data exists for free and you are largely limited only by your time and patience. Feel free to skip to 6.
The benefit of using a curated service, such as OpenStreetMap is that most of the design and display options are preconfigured and are often “good enough.” OpenStreetMap data can be incomplete, out of date, or otherwise inaccurate based on community support for your area of interest. Adding third party data and properly designing and labeling custom data can be very involved as many customizations are possible. These customizations are beyond the scope of this introduction however a partial example is provided to demonstrate basic functionality.
- Locate a third party GIS dataset (shapefile format preferred) from any appropriate source such as an internet data portal. Examples of data portals can include:
- https://hub.arcgis.com/search – ESRI is a commercial GIS company that provides a variety of hosted datasets, many (but not all) will be compatible with QGIS
- Many federal, state, and local governments will have similar data portals, a google search for “shapefile open data download” and then key words related to your geographic or thematic area of interest is likely to return useful results, for example multiple data portals hosted by the state of Virginia can be found here:
- https://data.virginia.gov/ (includes non GIS data too)
- https://vgin.maps.arcgis.com/home/index.html (more specific to GIS data, note the “arcgis.com” domain, many organizations make use of this software to host their data)
- When searching for data, each website/source may provide a different user interface, the following points are worth keeping in mind
- Different file formats of GIS data exist, the most basic/universal is called a “Shapefile” and will almost always be compatible with QGIS
- “Shapefiles” are usually bundled as anywhere from 1 to 8 different files that all share the same name but have different file extensions. The file with a “.shp” extension is technically the “shapefile” file, however if you do not also receive a file with the “.prj” extension (projection information), the data will be virtually useless without a fair amount of extra work.
- Generally speaking try to avoid changing the names of shapefile and their bundled support files and store them all in the same relative directory.
- When downloading data you may (but not always) have the option to select the file format, for this tutorial a “shapefile” format is preferred.
- Most GIS data exists as either point, line, or polygon vector data, when selecting a dataset look for the type and detail you are most interested in. For example, “building locations” can often be stored as either point locations or polygon files. Roads and streams are often provided as line files, but can be provided as polygons as well.
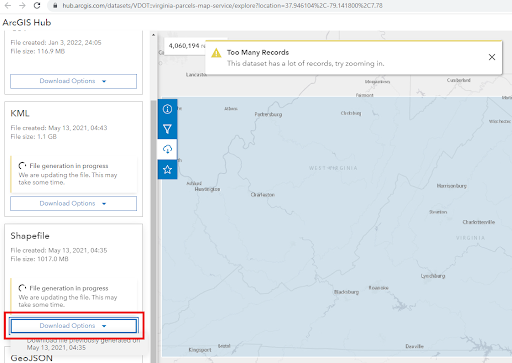
Above, an example of download options including Shapefiles, highlighted.
- Once a suitable file has been located, download it, extract it if needed (shapefile collections are often provided as zipped collections) and store it at a known location on your computer.
- Extract the 5 files supporting the shapefile to a known location (note, GIS files can get large), such as “D:\Data\GIS\Tutorial” (your location will vary…)
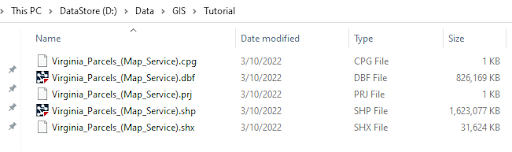
Above, an example of a group of related files, commonly stored in the same place but referred to as if it were a single “Shapefile”
- In QGIS, select the “Layer” Menu, then click “Data Source Manager” next make sure “Vector” data is selected, the “Source Type” will be “File” and you will want to navigate to the location where your data is stored. You will see all of the support files for any given Shapefile, select the file with the “.shp” extension and click “Add”
- Note, large files or slow computers may take a minute
- Assuming you have all of the bundled support files, most importantly the “.prj” file, you should be able to safely ignore the “options” that are provided
- After adding the data, click “Close” on the “Data Source Manager” (or simply move it out of the way) and locate the “Layers” Panel, your new layer should be added.
- If you do not see the layer in the main map window make sure the checkbox to the left of the layer is selected. You can also turn off other layers or click and drag to reorder the layers.
- You can right click on a layer and select “Zoom to Layer” to zoom to the extent of the layer.
- When a layer contains very small features spread out over very large areas it may be difficult to see the features, try turning off other layers and panning/zooming as needed.
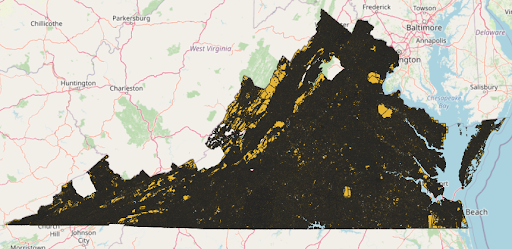
Above, an example of a state wide polygon file using default display settings.
Step 5: Simple Symbology of custom data (optional)
When adding third party or custom data you will likely want to change how the data is displayed. QGIS has many options for this however this guide will only cover a very simple use case. Data symbology can involve many factors including design and aesthetic preferences so it is difficult to provide “one size fits all” guidance.
- Return to, or find an area of interest
- In the “Layers Panel” click-drag the relevant layer(s) to a suitable order.
- Typically Basemap layers (like OpenStreetMap) should be on the bottom
- Usually “point” data should be on top of “line” data, and line data in turn on top of “polygon” data, however exceptions can occur.
- For any given shapefile layer, right click on the layer and click “properties”
- With the “Symbology” tab selected on the left, you have a number of options and presets for how the selected layer can be displayed.
- “Simple Fill” should be a default setting, if not available, remove any other options using the red “minus” button and add a “simple fill” using the green plus button, if needed.
- Click on the shaded color for “Fill Color” and drag the “Opacity” slider to be transparent (0%)
- Change the “Stroke” color, width, and style to your preferences (for example a light thin gray line) and hit “OK”
- Repeat Step(s) 3,4, & 5 as needed based on the data you’d like to show and how you would like it to be displayed.
Step 6: Preparing a Print Layout
Once data is added to a map, an area of interest is visible, and relevant data has been symbolized the result can be put into a print layout for export such as a PDF file. Many options exist however PDF files are fairly common and support a number of useful print options.
- From the “Project” menu select “New Print Layout” and provide a meaningful name if many layouts are expected. A new window will open, leaving the old window accessible as well.
- From the new Layout Window, right click on the blank canvass (the white square that represents the printable area) and click page properties.
- In the “Item Properties” panel, under page size select the size map for printing you are interested in.
- A “custom” size is available
- “Custom” size unlocks the Width and Height options and a number of units such as mm or inches are supported
- For example vendors like Vistaprint and Fedex-Kinkos allow for poster prints up to 36”x48”
- Printing and print proofing is its own sub-discipline, that often includes factors such as the printable area, printing resolution of the printer, paper quality and size as well as other factors. Defaults will be used to the extent possible.
- From the “Add Item” menu bar, select “Add Map” and then click and drag the approximate size and location of the map you wish to print on the canvass layout
- Depending on the amount of data and internet connection rendering the map on the canvass may take a moment
- Once added the map can be resized, and limited repositioning of the map position within the canvass is possible using the “Move Item Content” toolbar tool and click-dragging or mouse-wheel zooming
- Be sure to revert to the “Pan Layout” toolbar tool once the map content is positioned correctly. Using the wrong tool for switching between the map position and the layout tool can be frustrating so it is usually best to handle with care.
- Most printers can not fully print to the edge of a piece of paper so it is advised to leave a small border of “white space”
- For more exact control of the map item’s placement on the printable canvass, right click on the map area (make sure the “Select/Move item” toolbar tool is selected!) and click item properties.
- Under “Position and Size” you can enter in finer details about your placement. A bit of math is required relative to your printable area. For a 36”x48” canvass the following is suggested (make sure to use the upper left “Reference point” if using these numbers (in inches):
- “X” = 0.5
- “Y” = 1.5
- “Width” = 35
- “Height” = 44
- Traditionally Maps have Titles, credit data sources and other design elements. These can be added from the “Add Item” Menu, for example:
- From “Add Item” select “Add Label” and draw a label at the top of the page for a title
- Right clicking a map item and selecting “Item Properties” will expose relevant options such as a text box to add custom text (usually filled with “Lorem ipsum” by default) and options for changing font, font size, font color, etc.
- From “Add Item” select “Add Label” and draw a label at the bottom right of the page for data credit details
- Data is often subject to copyright and terms of use. This is especially relevant for any map you might share in a public setting (such as a tutorial!) however public domain data and personal use exemption are quite common for open data sources.
- OpenStreetMap has a generous but specific copyright and requests language to the effect of “© OpenStreetMap contributors (openstreetmap.org)” should be added
- In this example Virginia Department Of Transportation is listed as the author of the parcel data used and has a custom license that does not specifically claim copyright but rather a disclaimer that amounts to “use at your own risk”
- As a rule of thumb most data provided by governments will either be public domain or have generous terms of use, though aggregating quality data does take time and money it’s often provided as a public good (your taxes at work!).
- Exceptions do apply, for example it is technically possible (though probably illegal) to stream Google Maps imagery tiles into QGIS. Just because data is accessible doesn’t mean it should be accessed.
- Adding a scale bar is recommended for printed maps.
- Export PDF for printing
- From the “Layout” menu bar, click “Print…” and note the warning about streaming services, however this option appeared to produce a usable PDF file while testing.
Step 7: Printing large format maps
If you select a normal 8.5”x11” canvass and have a home printer you should be able to print following your normal printer procedures. PDF files can usually be opened by web browsers or free software. In fact starting with smaller maps on a home printer is advised to get a sense of print-related issues prior to spending more on larger formats.
Large Format maps can be obtained from retail printing services that produce poster style products. For example both VistaPrint and Fedex-Kinkos have online tools. Some print vendors may have additional options that allow for oversize prints that are non standard.
As previously alluded to, printing and print proofing is a sort of subdiscipline of its own. VistaPrint provides a “Digital Proof” that attempts to be more representative of actual print quality but you should be aware that a print vendor will simply print the file they are provided. If you provide a file that is low resolution and highly pixelated, to the point of being unusable, you will probably not get a refund. There are steps you can take to mitigate this, for example PDF files can support vector based graphics and text meaning that the hypothetical upper limit of the print quality should be dependent only on the hardware rather than the data file but determining how to most effectively make use of these features is beyond the scope of this guide. As demonstrated the PDF export and resulting print may not always be 1:1 perfectly representative.
All this is to say: be careful, you might spend $60 on a map that looks good as a PDF but prints terribly based on a setting during export.
That being said, this is something I’ve been wanting to do for myself for ages and since I finally found a good/easy enough way to do it, I thought I’d share here.there is a lot of online help available, I may be able to answer a few questions if something I wrote above is unclear but keep in mind I don’t necessarily check here daily.
If you do try this and find it useful, I’d be mildly curious about what other use cases are out there. If someone has a good idea I might be inspired to do a follow up (no promises though!).
-
Comments (7)
-