Summary:
- Scale is how zoomed in or out a map is, such as one inch equaling one mile.
- The first thing you should look at in a road atlas is the legend, which explains what lines and symbols mean.
- Other important atlas features: the index, which gives page numbers for all major locations and tables that help estimate travel times.
- Map coordinates help you identify and communicate locations.
- Important standard coordinate systems to know: Universal Transverse Mercator (UTM), Military Grid Reference System (MGRS), and the MGRS civilian equivalent, the US National Grid (USNG).
- MGRS and USNG are roughly equivalent for most purposes and both are based on UTM.
- UTM, MGRS, and USNG use eastings and northings in meters for coordinates. You always read those grids by going right (easterly), then up (northerly).
- USNG coordinates are composed of a three-character zone designation, a two-letter code designating a 100,000-meter area, easting coordinates, followed by northing coordinates, like so: 18TWL8563111326.
- You can drop some of the coordinate numbers when less accuracy is required. If you and another party know the general area, you could abbreviate the above coordinate to WL8563111326 or even 8563111326.
- If less accuracy is required, you can cut off the last digits of the easting and northing coordinates: 856113. Never round UTM, MGRS, and USNG coordinates.
- Contour lines on a topographic map indicate elevation. Close contour lines indicate steep terrain and wide contour lines indicate gentle slopes. No contour lines mean flat land.
- Topographic map colors: Forested areas are green, water is blue, man-made structures are black, etc.
Reading scale
Scale defines how many map measurement units equal how many real world units. The scale also defines how large of an area the map covers and in how much detail. There are three ways maps convey scale:
- A verbal scale, like 1” = 100’
- An RF scale, which is a ratio of units, like 1:24,000, which means that one inch equals 24,000 inches.
- A bar scale, which is a visual representation of the scale. This is the most important scale feature for navigation.
Here’s an example of a bar scale. On the top line, a measurement from 0 to 1 represents a kilometer or 1,000 meters on the map. On the second line, the measurement from 0 to 1 represents one mile on the map. The third line represents feet.
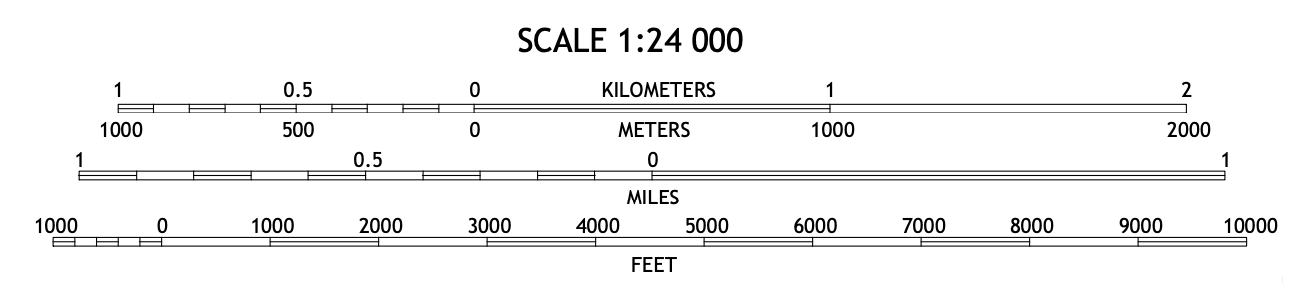
American road maps tend to be in miles, while topographic maps are in meters. You may have seen a military movie where a soldier talks about traveling so many “klicks,” which is military lingo for kilometers.
Metric is better to use in the field because the conversions are easy: 100 centimeters is a meter, 1,000 meters is a kilometer, and 100,000 meters is 100 kilometers. If you’re looking at a 1,000 meter grid, you know that ¼ of the grid is 250 meters. That’s much easier to calculate in the field when you’re sweaty and stressed than trying to remember that three miles is 15,480 feet.
How to use a road atlas
Road atlases are somewhat self explanatory, and usually have instructions inside, but here are some tips.
Legend
The first thing you should find in your atlas is the legend, which should be at the very front of the book. It explains what symbols, lines, and numbers mean, and there may be other usage instructions and tips nearby. Make sure to note how exits and other numbers are presented.
Note: DeLorme state atlases simply mark exit numbers with black text and don’t explain that in the legend.
Index
Atlases show state-level views with call-outs for large cities. A state atlas has multiple views of the state as well as larger city maps.
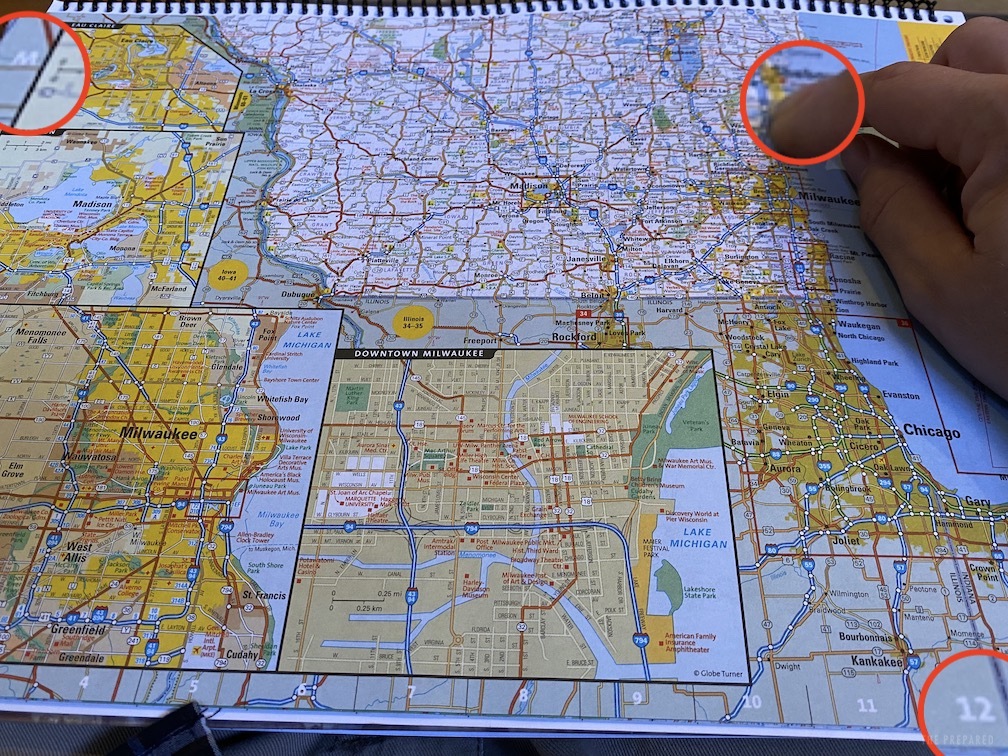
Note the grid on each page. If you refer to the index in the back, it’ll give you page numbers and grid coordinates for locations. The Rand McNally and National Geographic national atlases divide locations by state, with a page range for each state and then grid coordinates for each location. In DeLorme state atlases, it looks like 74 A-6, which means page 74, grid location A-6.
If you want to look up Sheboygan in the National Geographic atlas, flip to the Wisconsin entry in the index, which tells you to look at pages 118-119. Then look for Sheboygan, which is marked M12. Turn to page 118, which shows a two-map spread of Wisconsin. Find M on the left and follow it to the 12 on the bottom.
Estimating distance and travel time
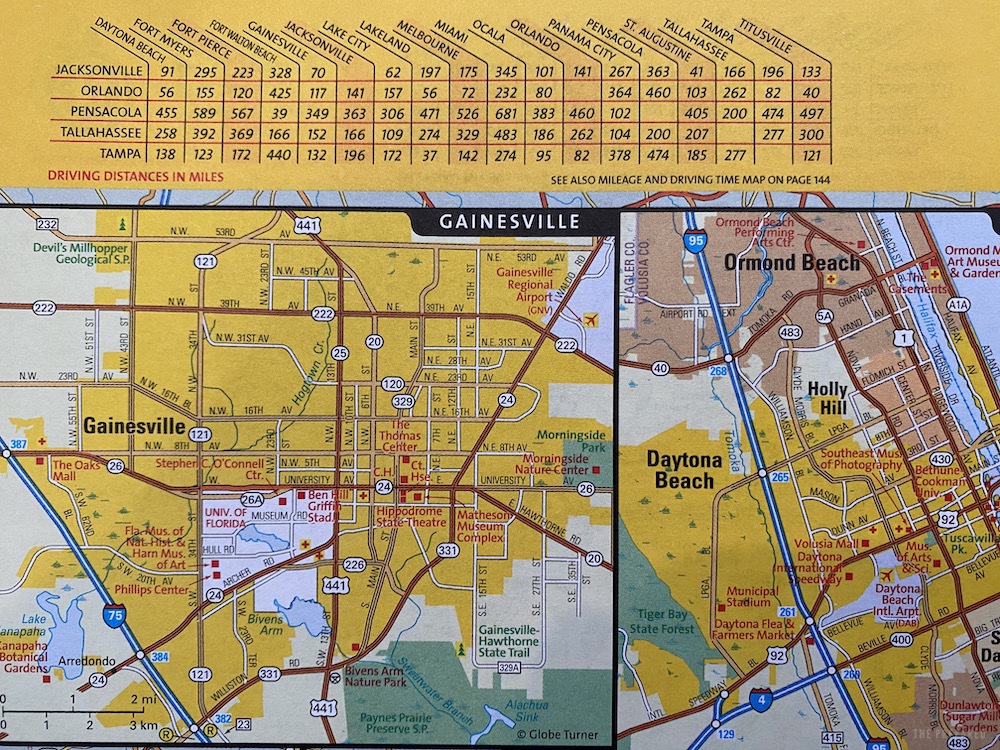
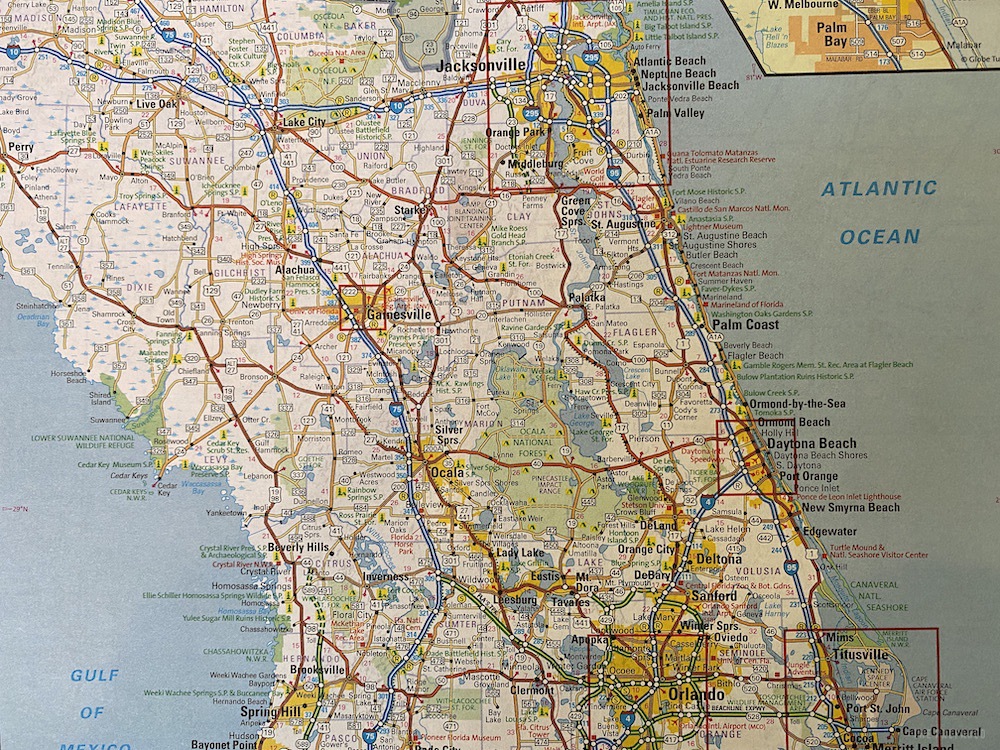
Two useful features of atlases are distance and time travel tables. For instance, on page 27 of the National Geographic atlas, it shows a table of distances between cities in Florida. Say you want to drive from Orlando to St. Augustine. Find Orlando on the left side and follow it until Orlando and St. Augustine intersect, which tells you 103 miles.
Atlases have maps that show travel times between major cities. Find the line that connects the two cities to get the estimated hours and minutes of travel. If there isn’t a direct line between two cities, follow the path and add up the time on each line.
Not every city is listed on the time map. The National Geographic atlas doesn’t have St. Augustine, so you have to guesstimate. Follow the 50-minute line between Orlando and Daytona Beach, and then follow the 1:25 line from Daytona Beach to Jacksonville. Add them together to get 2:15. Looking back on page 27, St. Augustine is about 60 miles southeast of Jacksonville (the width of a finger is about as wide as the 10-mile scale line). Subtract 30 minutes from the travel time to estimate 1:45 to get from Orlando to St. Augustine.
There’s a more accurate yet more-tedious way to measure distance on an atlas. If you look closely at a map in an atlas, you should see little numbers by major roads. Some of those numbers should be miles between two points — check your legend near the front of the atlas to see what the individual numbers mean. Some numbers are measures of miles while others are exit numbers.
Tip: You can buy credit-card-sized fresnel lenses for cheap, which help you see tiny map details, have a small ruler for measuring distances, and can even help you start fires.
Planning a route
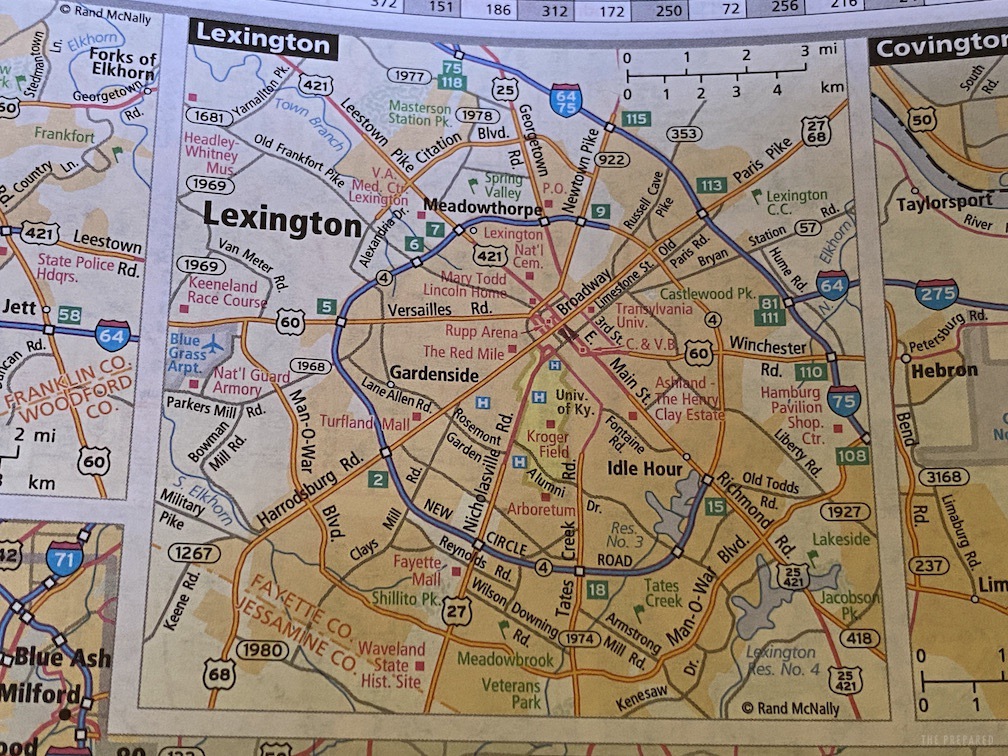
To chart a route between two places, first make sure you have the right map. If you’re traveling from Nashville, Tennessee to Lexington, Kentucky, a Tennessee atlas won’t do so you’ll want a national atlas.
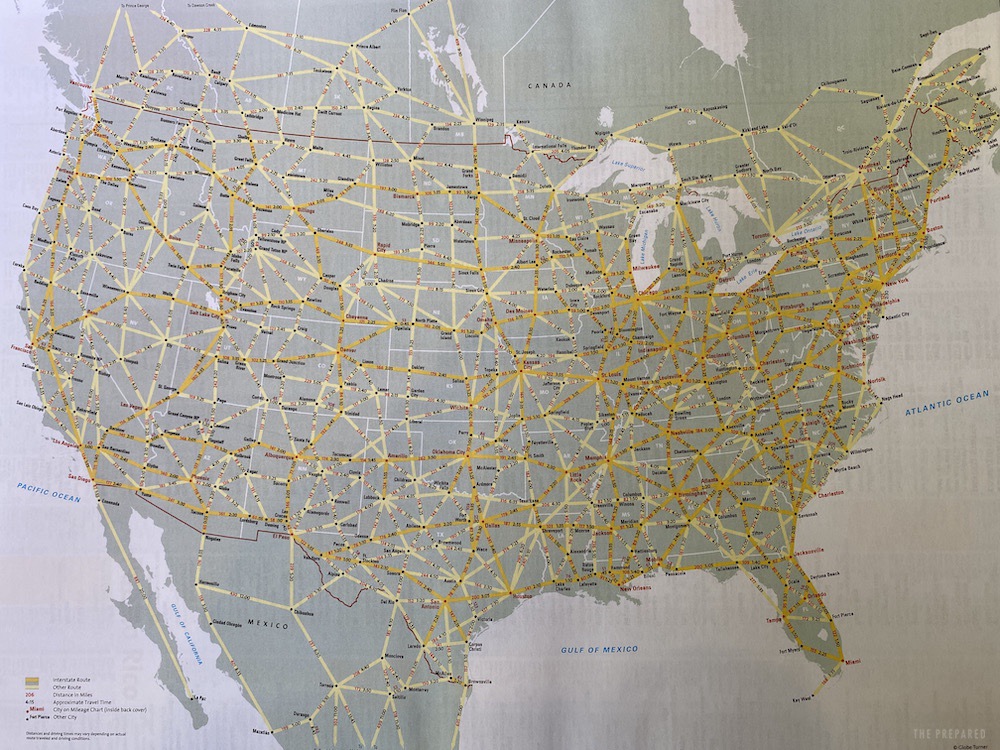
Start at the smallest scale map possible and then switch to a larger-scale map for more detailed views. A national atlas should have a nationwide interstate map near the front of the book. If you look at the map in the Rand McNally atlas, you can see that from Nashville you’d take I-65 north to Elizabethtown and then take Blue Grass Parkway east to Lexington. But which exit number is that?
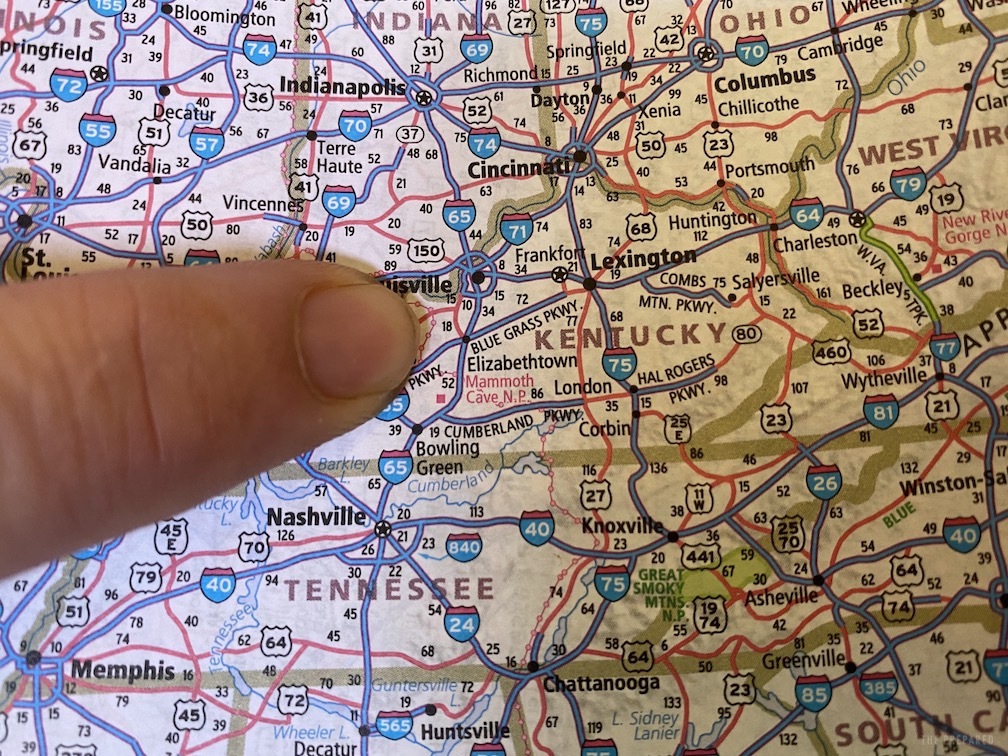
Flip to the Kentucky pages, find Elizabethtown, and then Blue Grass Parkway, which shows that it’s exit 10. Follow Blue Grass Parkway with your finger and you see that it eventually ends at Highway 60. Turn right at Highway 60, which takes you to Lexington.
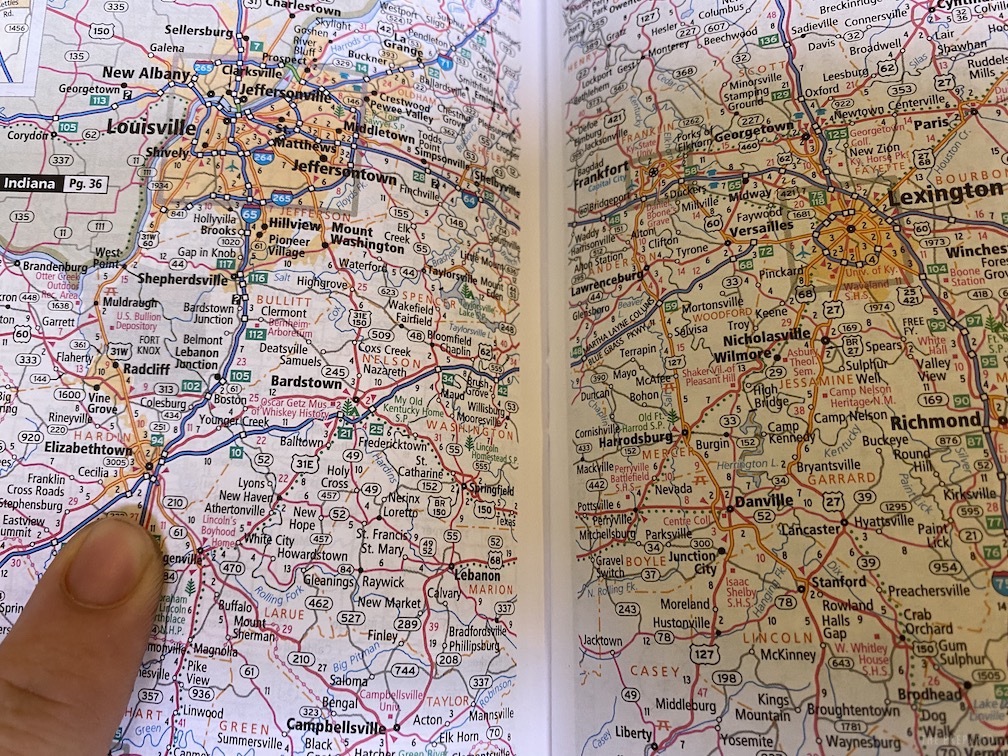
Then look at the Lexington callout and find Highway 60 to the west. That takes you to New Circle Road, which loops around Lexington. There are exit numbers for New Circle Road, so you can pick the one closest to where you want to go. From there, you’d want a city map of Lexington.
Here’s a video showing how to use a road atlas:
The next time you make a trip, try plotting a route with a paper map. You can check it against Google Maps or use your GPS as a backup.
Coordinate systems
A map without some sort of grid is just a picture. Outside of consumer-grade road atlases, there are several standardized systems for identifying and communicating locations, and three you should know: latitude and longitude, Universal Transverse Mercator (UTM), and the US National Grid (USNG).
Latitude and longitude
Most of us learned about latitude and longitude in school. Latitude refers to the north-south position of a coordinate. Picture 180 imaginary horizontal lines — 90 north and 90 south — spanning the earth, from the North Pole to the South Pole. Those imaginary lines are called latitudes or parallels. If you have trouble remembering, think latitude = ladder, like the rungs of a ladder.
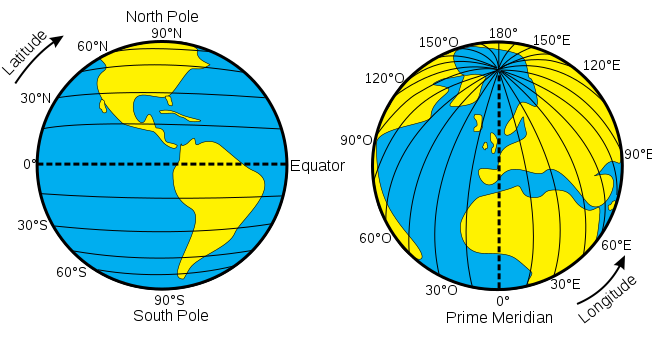
The key latitude is the equator, which is halfway between the North and South poles. In modern nomenclature, the equator is zero degrees (0°) latitude, and all other latitudes are defined by it. The North Pole is at 90°N and the South Pole is at 90°S. All latitudes fall between those two extremes. Each latitude is approximately 69 miles apart, but since the earth is curved, the distances vary a bit.
Longitude defines the east-west position of a coordinate. Picture 360 imaginary lines — 180 east and 180 west — spanning the earth from the North Pole to the South Pole. While everyone agrees on the equator being the origin of latitude, not everyone agrees on what the central longitude should be. The Western standard is the Prime Meridian, which is the longitude that passes through the British Royal Observatory in Greenwich, England. Most longitudes you see will be defined by the Prime Meridian. Both extremes, 180°W and 180°E, meet in Greenwich.
On the opposite side of the Prime Meridian is the International Date Line. It’s the line at which you cross from one day to the next. (Some countries alter that dateline for political reasons.)
Distance between longitudes varies greatly. They meet at the poles and are furthest apart at the equator.
To add greater precision, latitudes and longitudes are further divided into minutes and seconds. Each degree is divided into 60 minutes and each minute is divided into 60 seconds. Each minute of latitude is about a mile.
There are two common ways to denote longitude and latitude. The first is Degrees-Minutes-Seconds (DMS). It looks like this:
40°44’54.384”N 73°59’8.3904”W
For the northern coordinate, that translates to 40 degrees, 44 minutes, 54.384 seconds north. You could simplify it (with less precision) to 40°44’54”N or you could cut out the seconds: 40°44’N.
The second common way to represent latitude and longitude is decimal degrees (DD), which is more computer friendly. So instead of 40°44’54.384”N 73°59’8.3904”W, you would see 40.764460514309114, -73.98106857921982.
Tip: Paste both 40°44’54.384”N 73°59’8.3904”W and 40.764460514309114, -73.98106857921982 into the Google Maps search field and see where they take you.
You should be familiar with the terms around latitude and longitude because they come up in other systems. Latitude and longitude are used primarily for air travel, sea navigation, and in GPS software.
Universal Transverse Mercator
The curvature of the earth is a pain when working with flat maps. So geographers have devised what are called projections to transpose a round surface onto a flat map.
The downside of projections is that they are inherently distorted. For our purposes, they’re accurate enough, but it’s impossible to perfectly translate a sphere into a flat rectangle.
One of the projections you’ll encounter the most often is the Universal Transverse Mercator (UTM). Its development is credited to the US Army Corp of Engineers in the early 1940s, and is based on the 16th century Mercator projection.
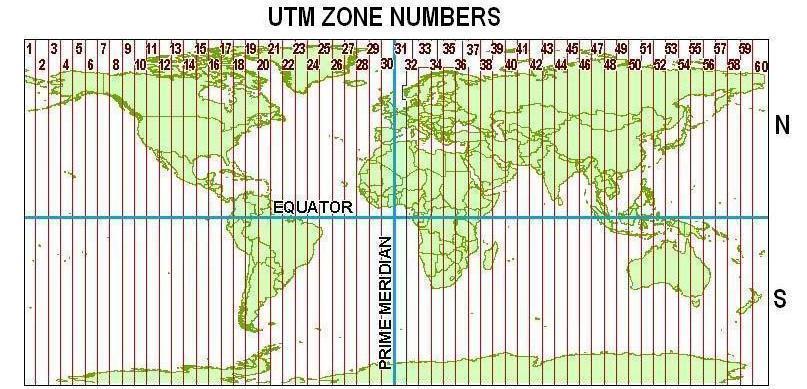
UTM divides the world into 60 longitudinal zones, each representing six degrees of longitude. Imagine taking an orange, peeling 60 strips of its rind from one end to the other, and then squishing those strips flat on a table.
The continental United States spans from UTM zone 10, the westernmost half of California through UTM zone 19, which contains Maine. Each zone is split into the northern and southern hemispheres, so there is a 10N and 10S. Each UTM coordinate starts with the zone and hemisphere.
Inside each zone is an independent grid defined not by latitude and longitude, but by what’s called eastings and northings, measured in meters instead of degrees. That makes UTM much more useful for land navigation than longitude and latitude.
UTM avoids negative numbers. Running down the middle of each UTM zone is a central meridian, which is an easting of 500,000 meters. An easting of 500,001 meters is one meter to the east of that meridian. An easting of 499,999 is one meter west of that meridian.
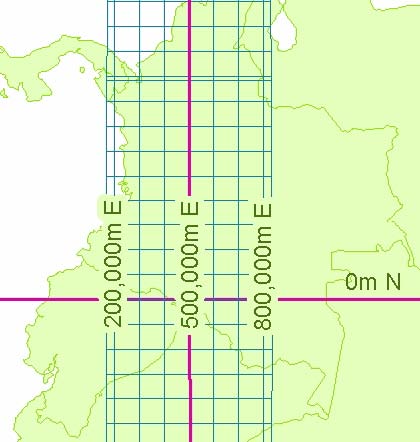
In the northern hemisphere, the bottom of the zone is the equator, marked at 0 meters. In the southern hemisphere, the top of the zone is the equator, marked at 10,000,000 meters.
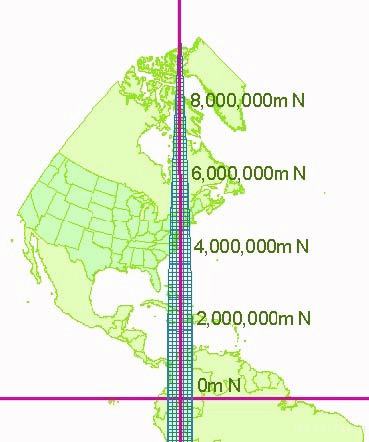
The very bottom-left of any half-zone map is 0mE 0mN. You always read UTM maps by going right, then up, or in geography jargon, easting then northing.
In reality, UTM coordinates look like this: 18N 585631mE 4511326mN.
That reads as zone 18, in the northern hemisphere. Then identify the easting on the map, which is 585,631. Starting at the zone’s central meridian, which is marked at 500,000 meters, you’d look to the right (east) 85,631 meters. Then you’d move up (north) 4,511,326 meters.
US National Grid
The United States government has created two spin-offs from UTM: the Military Grid Reference System (MGRS) and its civilian equivalent, the US National Grid (USNG). They are mostly equivalent, as long as both coordinates are based on the WSG84 datum (which most are, more on datums in our guide to the best maps). The USNG is meant only for use in the United States and territories, while the MGRS applies worldwide.
(Another thing to note is that while USNG and MGRS are interchangeable when they both use the WGS84 datum, they’re different if the two maps are using NAD27.)
There are three key differences between UTM and MGRS/USNG:
- MGRS/USNG use their own set of zones, called Grid Zone Designations (GZD). These correspond to UTM zones, but they replace the N/S designation with a letter designation to signify latitude.
- There is an additional two-letter 100,000-meter square identification.
- The coordinates are mashed together without any spaces or directional designations.
If we convert our UTM coordinate from above, 18N 585631mE 4511326mN, into USNG, it looks like this: 18TWL8563111326.
That translates to, zone 18T, Grid Zone Designation WL, and then it reads like UTM: 85,631 meters easting, 11,326 meters northing. The smaller zones and the GZD truncate those meter readings.
The presentation of coordinates is a bit different, but the MGRS/USNG grid and the UTM grid are one and the same. It’s common to see UTM, MGRS, and USNG used interchangeably, but you can tell the difference between MGRS/USNG and UTM by the coordinate format.
If you’re confused, don’t sweat. We have some exercises to help you understand how the grid works.
An exercise to practice your map grid skills
Here are some hands-on exercises to familiarize yourself with the concepts. Assuming you’re familiar with Google Maps, these exercises will take your existing Google Maps skills and translate those into:
- Working with latitude and longitude in DMS and DD formats
- Converting latitude and longitude to UTM and USNG coordinates
- Finding USGS maps
- Reading and understanding everything on a USGS map
- Locating yourself on a USGS map
- Extracting USNG and UTM coordinates from a USGS map
Convert latitude and longitude from Google Maps into USNG coordinates
Let’s look up a national landmark in Google Maps. National landmarks are marked on USGS maps, so you get an idea of how accurate your grid navigation skills are. We’ll use the White House as an example.
Visit Google Maps on a desktop web browser. In the search field, type White House and choose White House on Pennsylvania Avenue. Google Maps zooms into the White House with a red pin marker on it. Right-click (or Control-click on a Mac) and choose the first option, which copies latitude and longitude coordinates in decimal form to your clipboard.
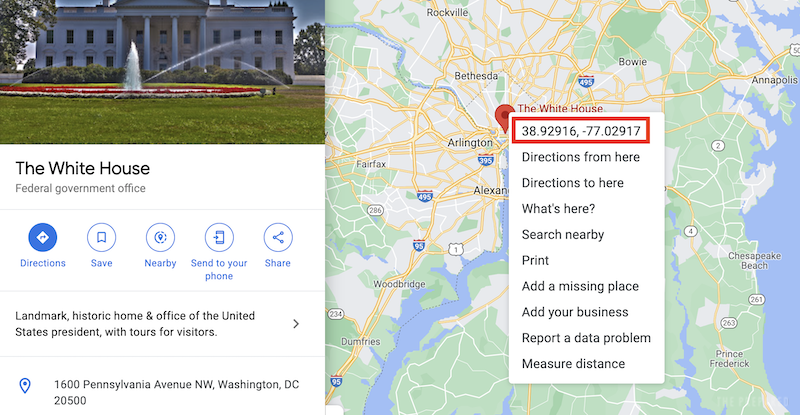
The coordinates Google Maps copies to the clipboard are too long for the conversion tool we’ll use and you’ll end up with inaccurate coordinates, but Google Maps can also fix that.
Go back to the Google Maps search field, select everything in the field, paste in the latitude and longitude you just copied, and press Enter or click the search icon. Look below, and you’ll have two sets of latitude and longitude coordinates: one in DMS, and another set in the correct decimal form. The White House is located at 38°53’52.3″N 77°02’11.6″W in Degrees/Minutes/Seconds (DMS) or 38.897860, -77.036551 in Decimal Degrees (DD).
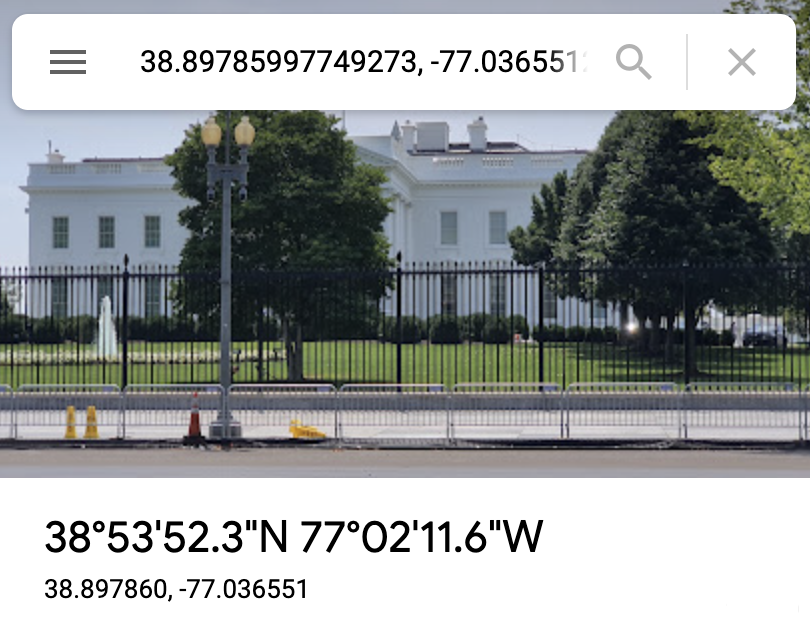
Note: Sometimes Google will give you slightly different coordinates, so if yours don’t match up exactly to our example, don’t worry. Just verify on the map that the pin is in the correct place.
Visit NOAA’s NGS Coordinate Conversion and Transformation Tool (NCAT), which converts latitude and longitude to UTM, USNG, and other coordinate formats. Try entering coordinates both ways to get a feel for it.
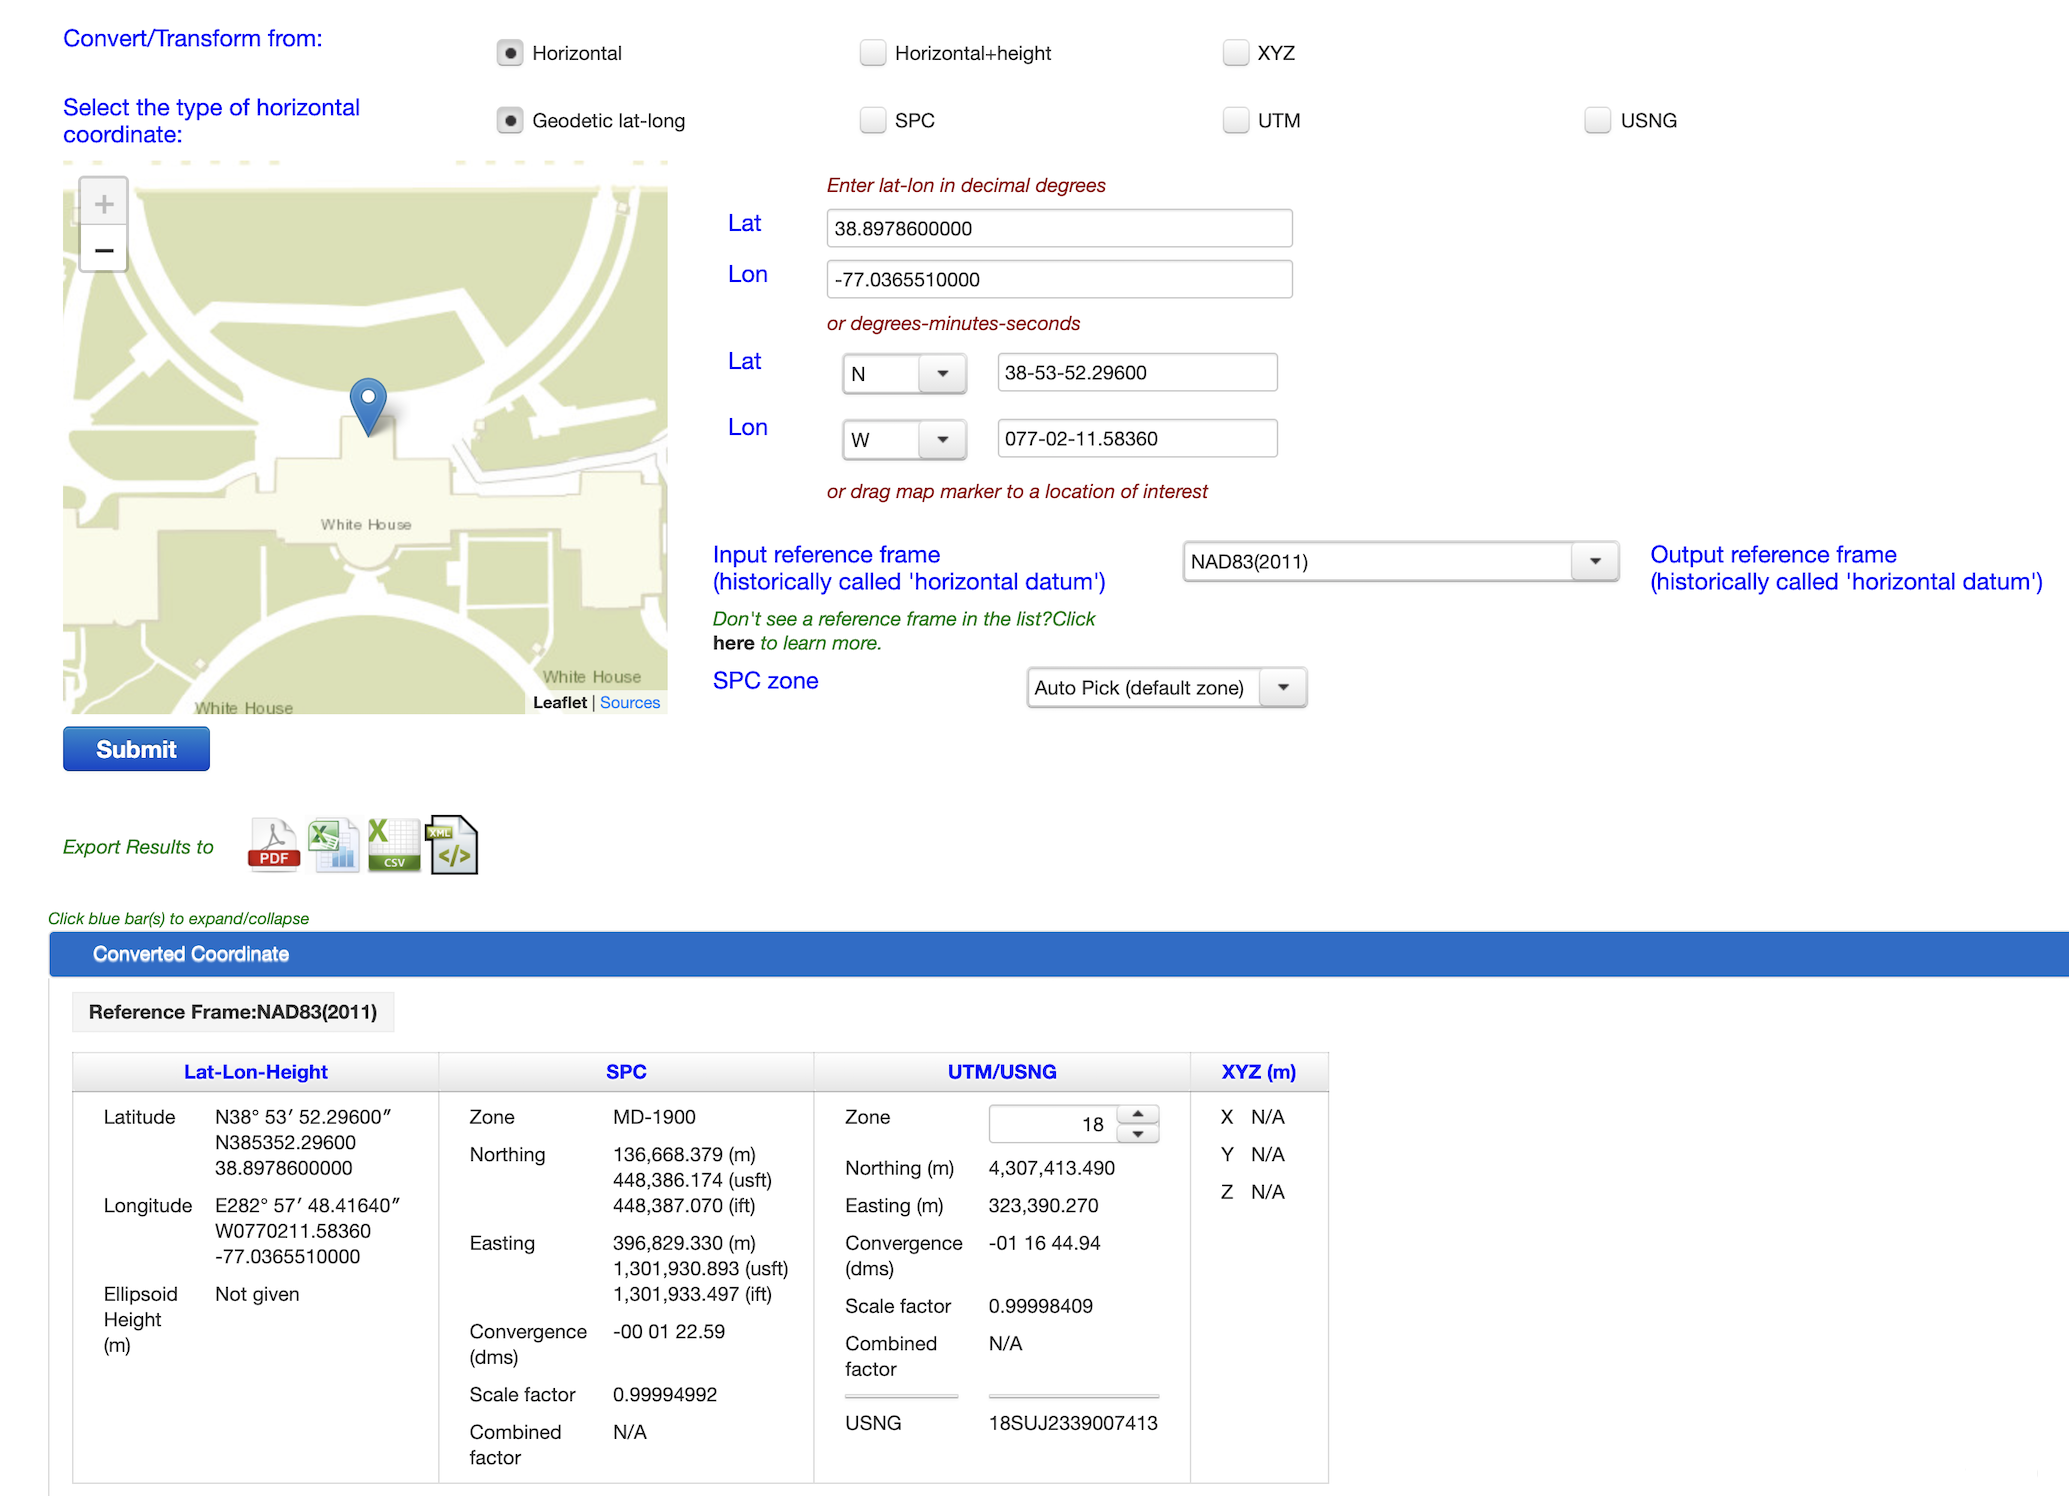
When entering coordinates in DMS format, type the numbers without any other characters. NCAT separates degrees, minutes, and seconds with a dash that it inserts for you. When you enter longitude, make sure to prepend it with a zero to enter it correctly.
Once you’ve inputted the latitude and longitude, click Submit.
Look under Lat-Lon-Height, which gives coordinates in DMS and decimal formats. Compare those numbers to Google Maps and make sure they match. The formats are slightly different, but the numbers should match up. Zoom in on the map to make sure the pin is on the White House.
Look under UTM/USNG, which gives the zone, northing, and easting. Then look for the entry for USNG, which should be 18SUJ2339007413. (Again, if yours is slightly different, it’s not a big deal as long as your marker is on the White House.)
Reading USNG coordinates
Let’s break down 18SUJ2339007413:
18S: This is the USNG grid zone designation, and it aligns with the UTM zone. So UTM and USNG zone 18 are the same slice of the globe, except UTM would designate it as 18N for the northern hemisphere and USNG designates it as 18S for being in the middle latitude of the United States.
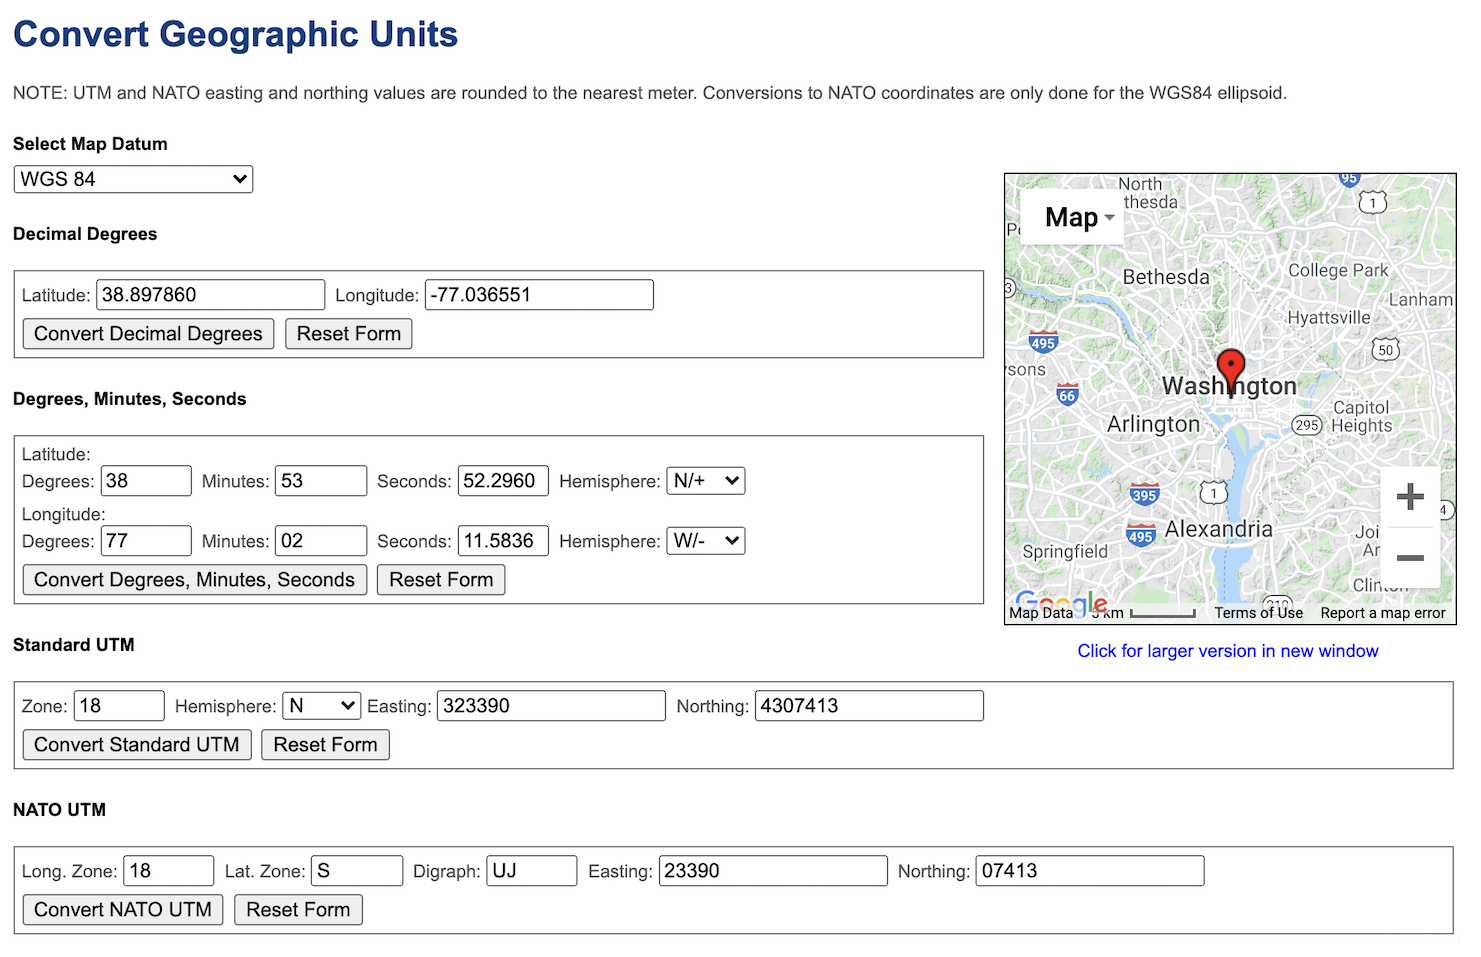
You can see the difference by plugging in the latitude and longitude into Montana State University’s converter, which gives both the standard UTM and USNG (which it calls NATO UTM). UTM 18N 323390mE 4307413mN and USNG 18SUJ2339007413 are the same coordinate in different systems.
UJ: These two letters define the regional area inside the zone, a 100,000-meter or 10-kilometer square. If you’re communicating with someone inside that general vicinity, you can drop the first five characters of the USNG coordinate for simplicity, like so: 2339007413.
23389: This is the easting coordinate in meters. For getting your map bearings, you want to at first focus on the first two digits, 23, which are marked on the map grid. You will estimate the last three digits on the map.
07410: The last five digits are the northing coordinate in meters. Focus on the first two digits, 07.
Use USNG coordinates to download a USGS US Topo map
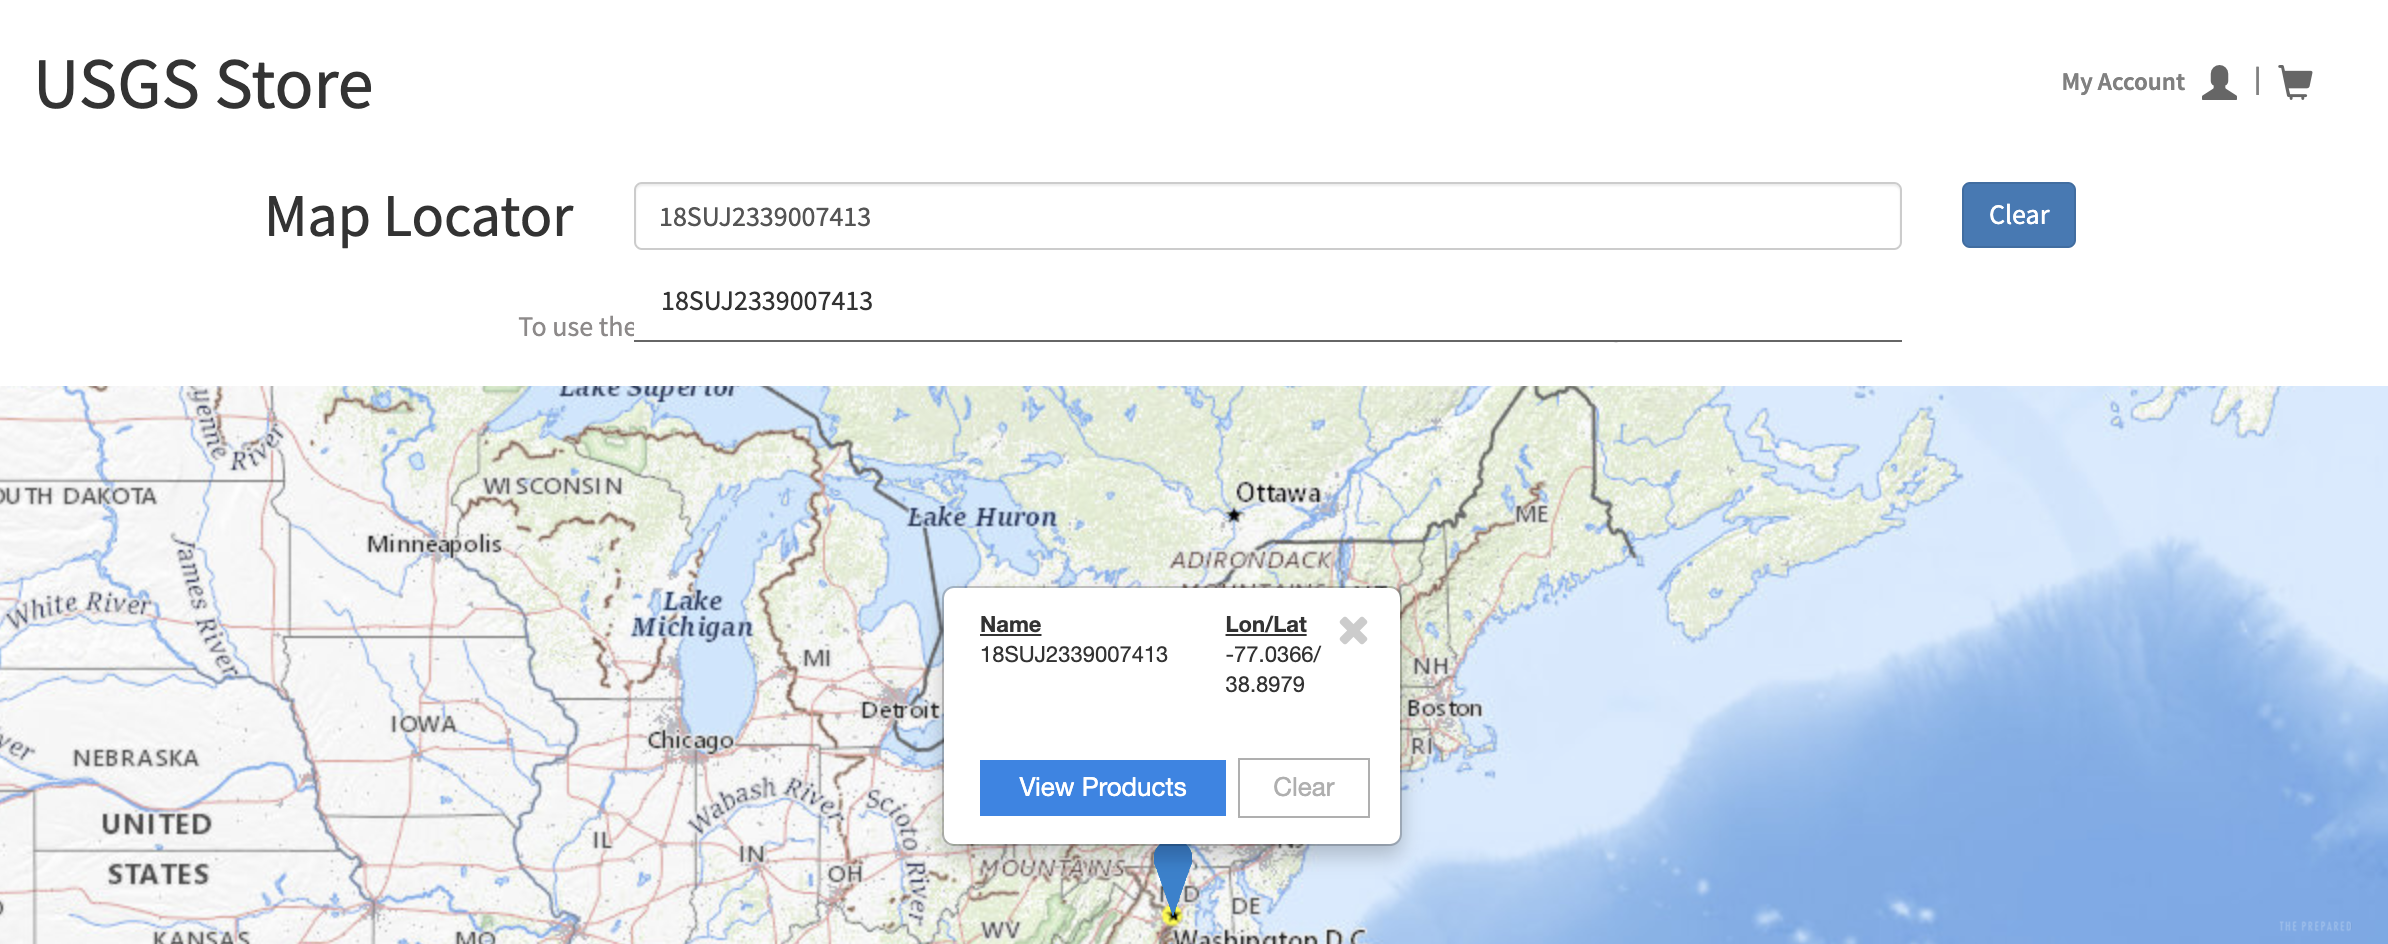
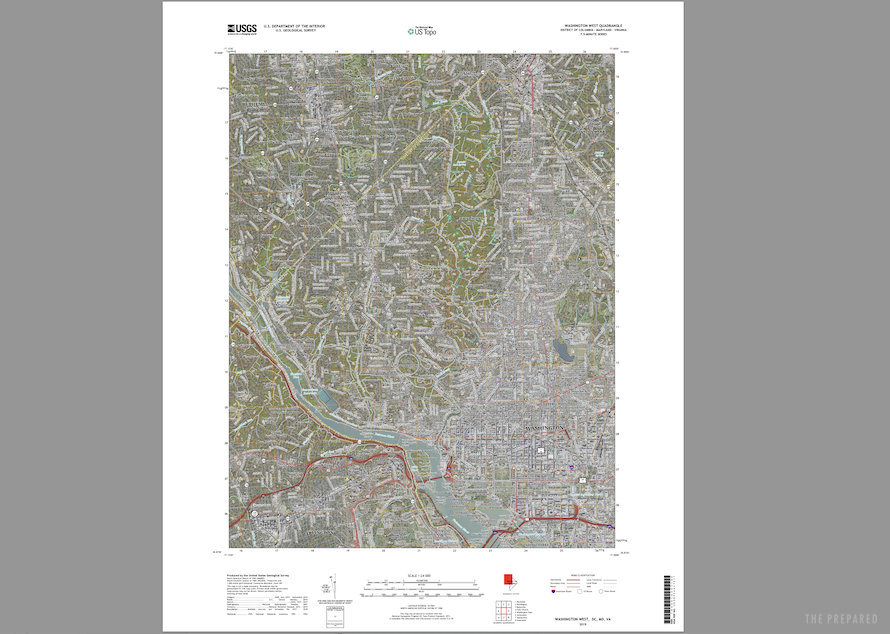
Now, copy those coordinates, 18SUJ2339007413, and visit the USGS Store Map Locator. The USGS provides free topographic maps in PDF form you can print out or you can order a copy for a nominal fee.
Paste 18SUJ2339007413 in the Map Locator field and wait for the auto-suggestion to appear underneath, which should say 18SUJ2339007413. Click that. A blue marker with a card appears on the map. Click View Products.
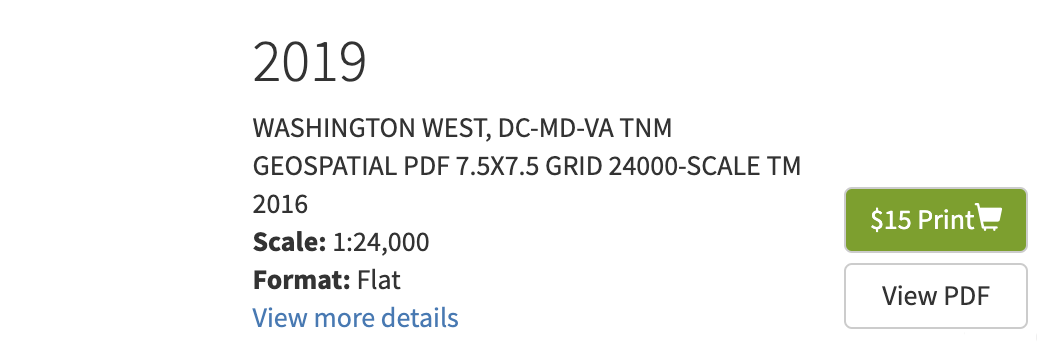
On the right, a list of available maps appears. Scroll down to find the one labeled 2019 and click View PDF to download it. Be aware that this is a large download, about 84 MB.
Find a location on a USGS US Topo map
Open that file, DC_Washington_West_20191122_TM_geo.pdf. If your computer is too slow to display it, you could have it printed, but its full size is 24-by-29 inches. (More on map printing in our guide to the best maps.)
Zoom in as far as you can while still displaying the coordinates on the sides of the map. Let’s find the White House.
Tip: At a map scale of 1:25,000, 1 centimeter equals 250 meters. At 1:50,000, 1 centimeter equals 500 meters.
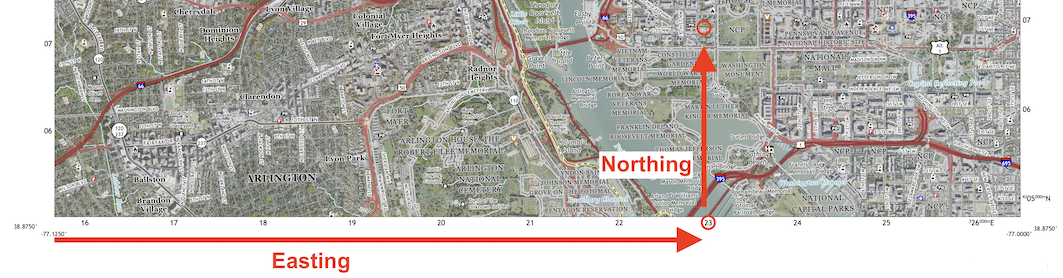
When finding UTM or USNG coordinates on the map, you first go right then up. In other words, start with easting and then move up to northing. Look at the bottom of the map and you should see a series of numbers from 16 to 26 (ignore the 3, 000, m, and E for now). The first two digits of our easting coordinate is 23, so find 23. The first two digits of our northing coordinate are 07, so trace up from 23 along the line until you reach the 07 line. You’re now on the 1,000-meter (1 kilometer) square that contains the White House. Let’s narrow that down further.
Inside the 23, 07 square, we want to again move right then up to find the White House. But there aren’t any lines to follow! Thankfully, because we’re working with the metric system, everything is base-10.
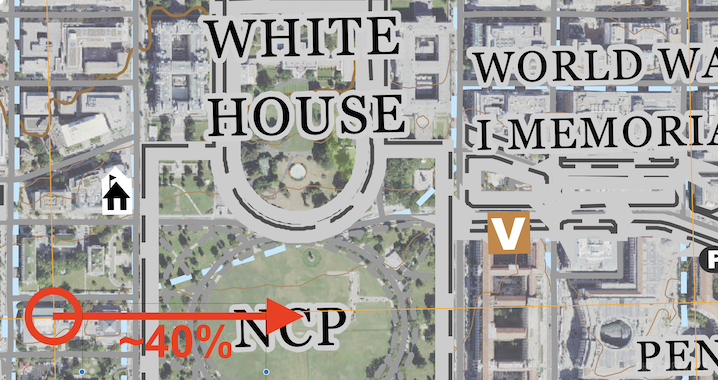
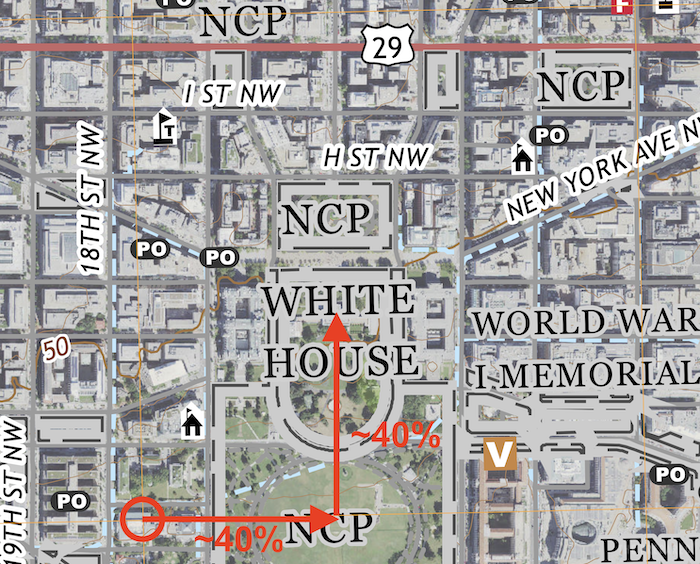
Take another look at the easting coordinate, 23390. You’re already on the 23, but now you need to move 390 meters to the right from the 23 line. The square represents 1 kilometer, which is 1,000 meters. Let’s round 390 up to 400. 400 meters 40% of a kilometer, so from the bottom-left grid corner, move 40% to the right.
Now you need to find the northing coordinate, which is 07413. You’re on the 07, so you need to move 413 meters north (or up). Again, about 40% up from the 07 line. Your finger or marker should be right about on the White House. If not, try again.
Try the same method to find other landmarks, like your house. Practice until you can comfortably find the correct map and the desired location on the map.
Tip: A map grid tool helps you take precise measurements on UTM and USNG maps.
Find adjoining USGS maps
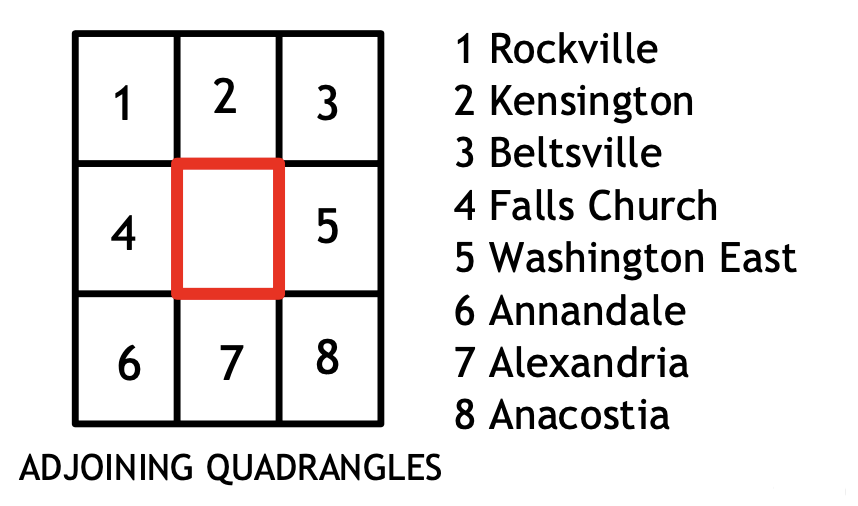
As large as USGS maps are, they cover a relatively small area, 100,000 meters (100 km). Our map has the White House, but not the Pentagon, which is just south of the White House. The map itself tells us how to find adjoining areas.
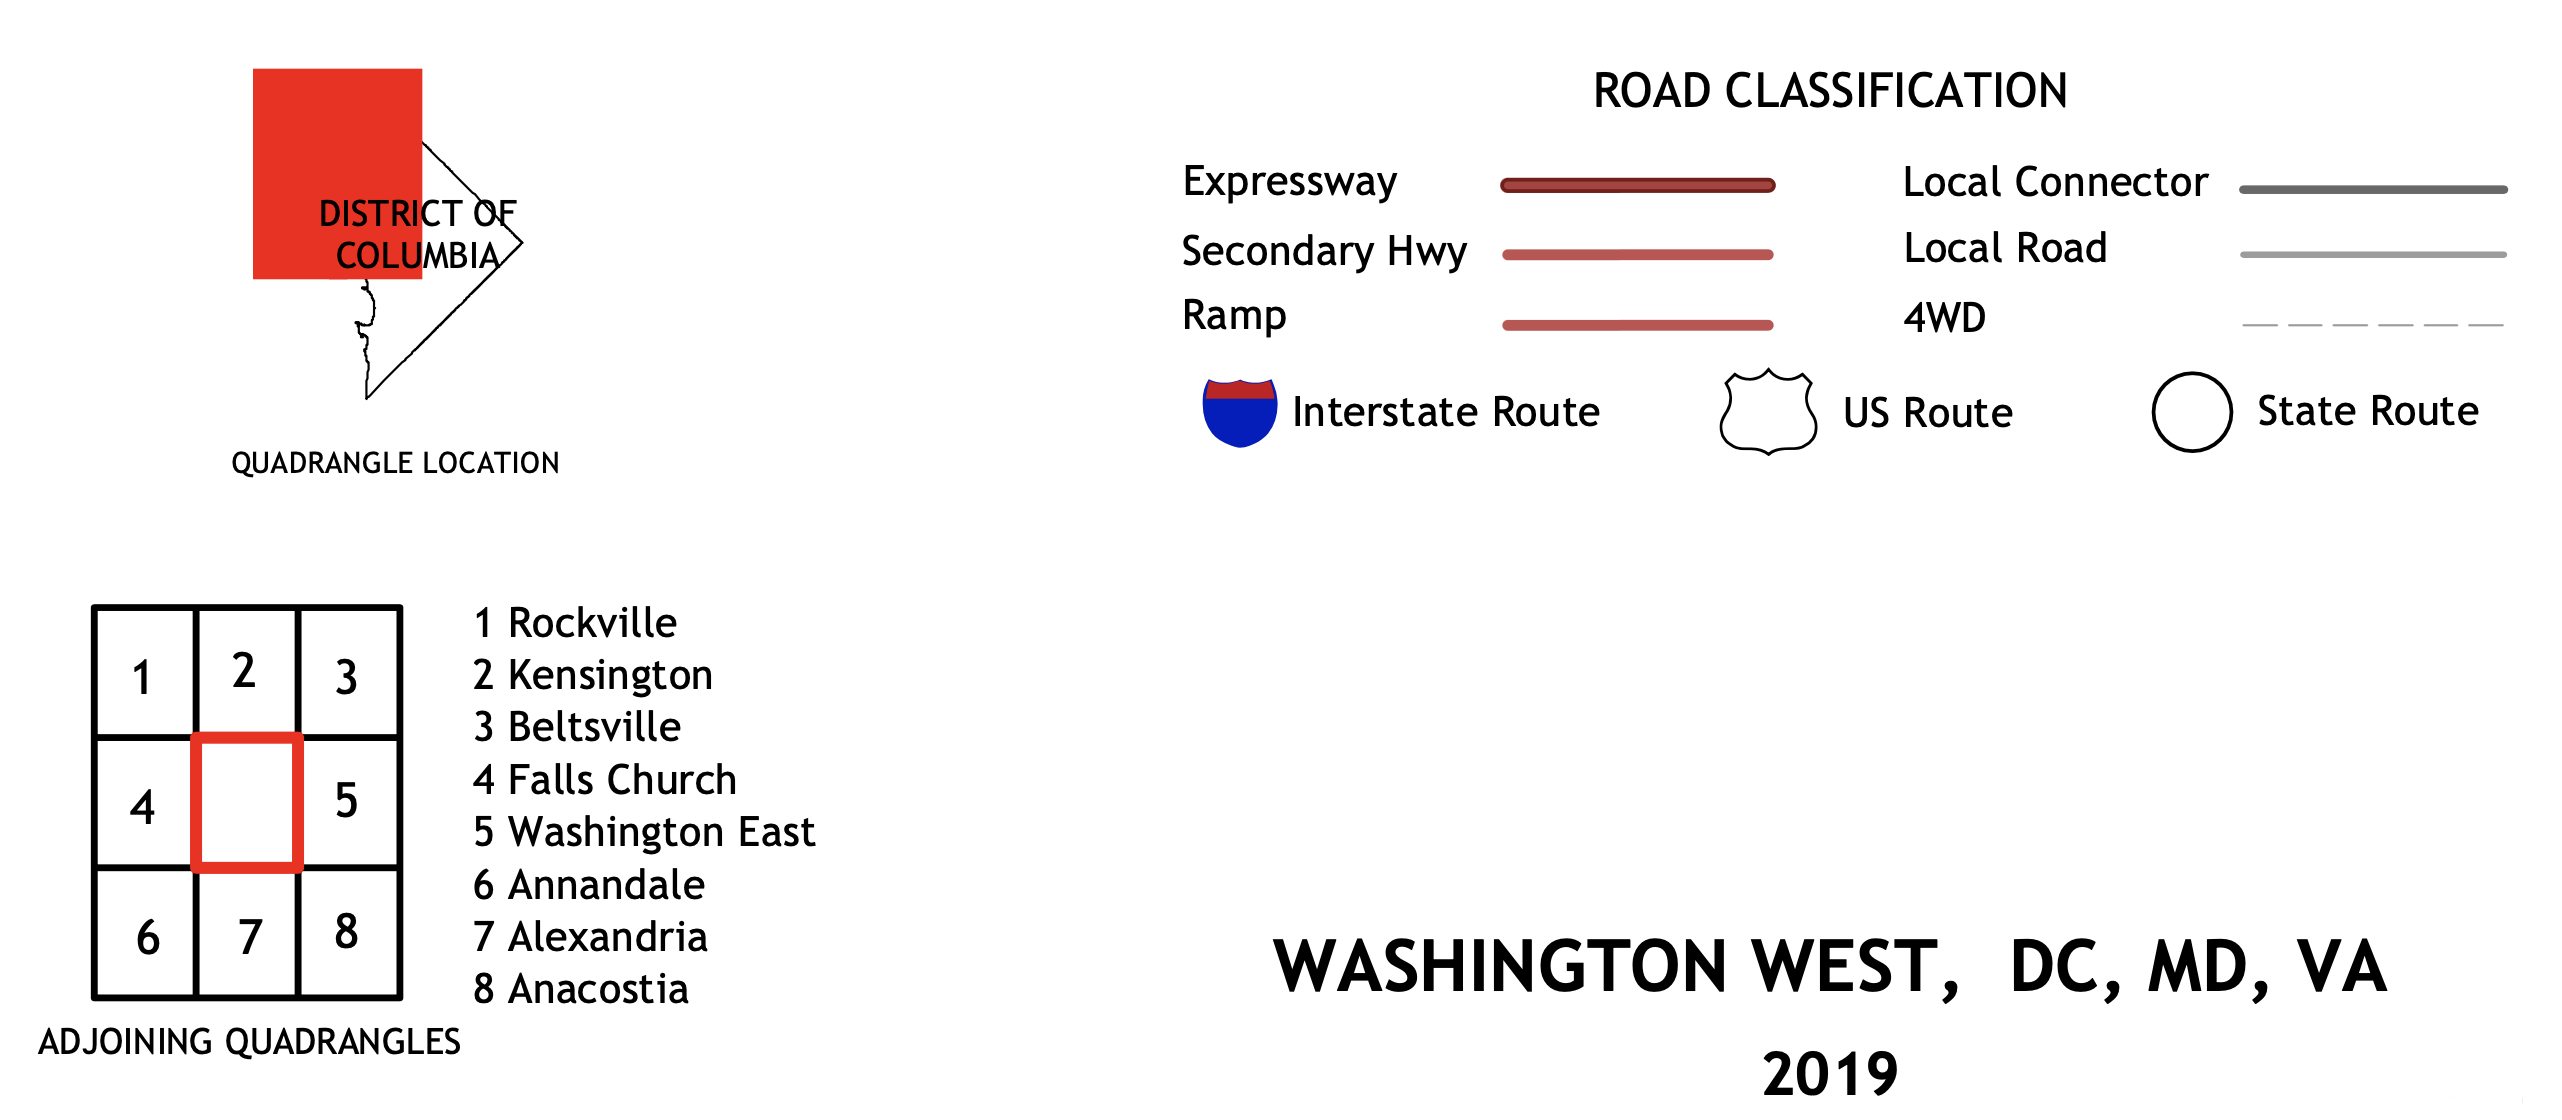
Look near the bottom of the map for a grid of 9 squares. Inside the grid is a red rectangle, which denotes the current quadrangle you’re viewing. Around the center rectangle are numbered rectangles denoting adjoining maps. The legend tells you which number aligns with which map. The Pentagon is south of the White House, so we want map 7, Alexandria.
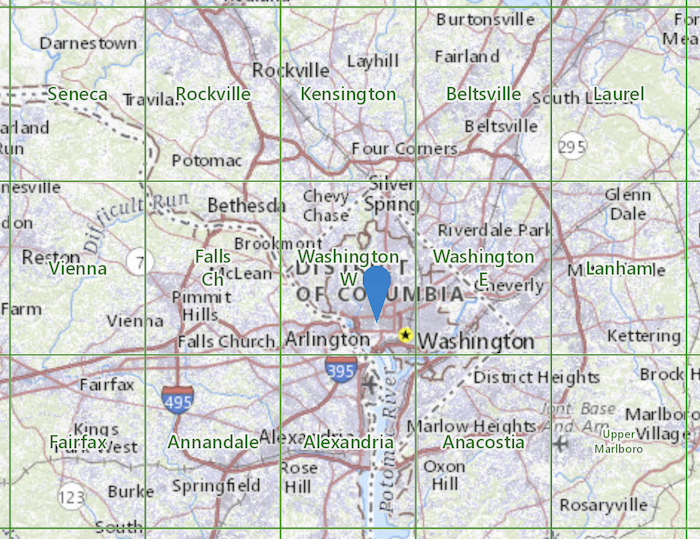
If you go back to the USGS Store Map Locator, the marker may still be there. Otherwise, search for the White House location again and then zoom in on the map until the grid appears. Each grid entry should reflect what you see on the map itself. Double-click in the desired grid square, Alexandria, to reveal a blue marker and a card where you can click View Products. Download that map, VA_Alexandria_20190823_TM_geo.pdf.
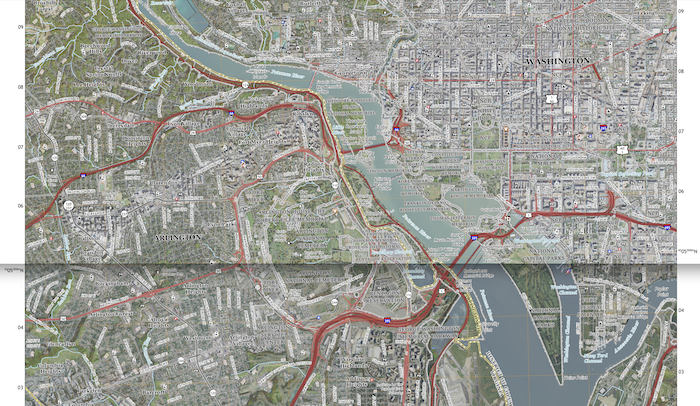
If you line up the maps so the Washington West map sits on top of the Alexandria map and align the grid lines, they should match up perfectly. Notice how the northing coordinates end at 06 on the bottom of the first map and then continue down to 05 at the top of the Alexandria map.
Breaking down a USGS US Topo map
Now that you know how to read the grid, let’s look at all the other parts of a USGS topographic map.
In the upper-right corner is the name of the map in all caps, like WASHINGTON WEST QUADRANGLE. Underneath that is the general area followed by “7.5-minute series.” That means the map covers 7 minutes and 30 seconds of latitude and longitude.
In each corner are latitude and longitude coordinates in decimals, which correspond to the point in each corner. So if the upper-left corner has 39.0000°, -77.1250°, those are the coordinates for that corner of the map. You could use that coordinate along with a special ruler to determine your latitude and longitude on any point on the map, but it shouldn’t be necessary.
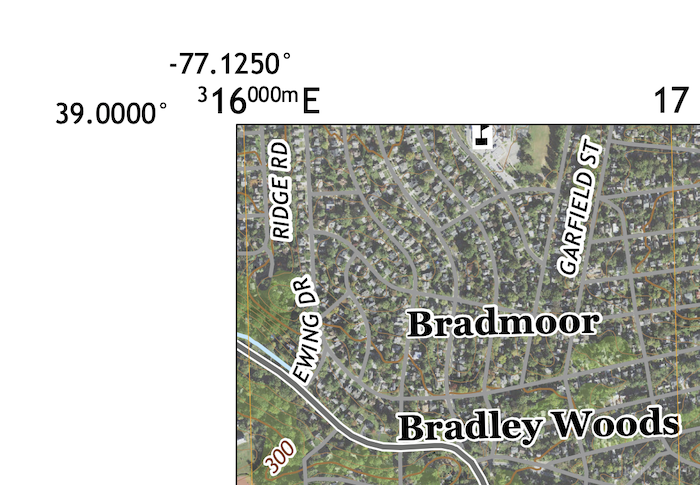
Also in the corners are the full UTM coordinates, presented with subscripts, like so: 316000mE and 4318000mN. The first, 316000mE, simply means that corner is 184,000 meters west of that UTM zone’s central meridian. Remember, the central meridian is marked at 500,000 meters, so you’d subtract the 316,000 from 500,000 to get 184,000. Likewise, 4318000mN means that point is 4,318,000 meters north of the equator.
Subsequent grid numbers omit all of that for clarity. On our map of the White House, follow 316000mE to the right to reach 17, which can be expanded in your head to 317000mE or 317,000 meters easting. Usually, you can simply refer to the grid numbers.
There is some important information in the lower-left corner telling you the dataset and geodetic system used. On modern USGS maps, that should be NAD83 and WGS84. Whenever comparing with another map, corresponding with another party, or using an online conversion tool, you want to make sure that information is the same.
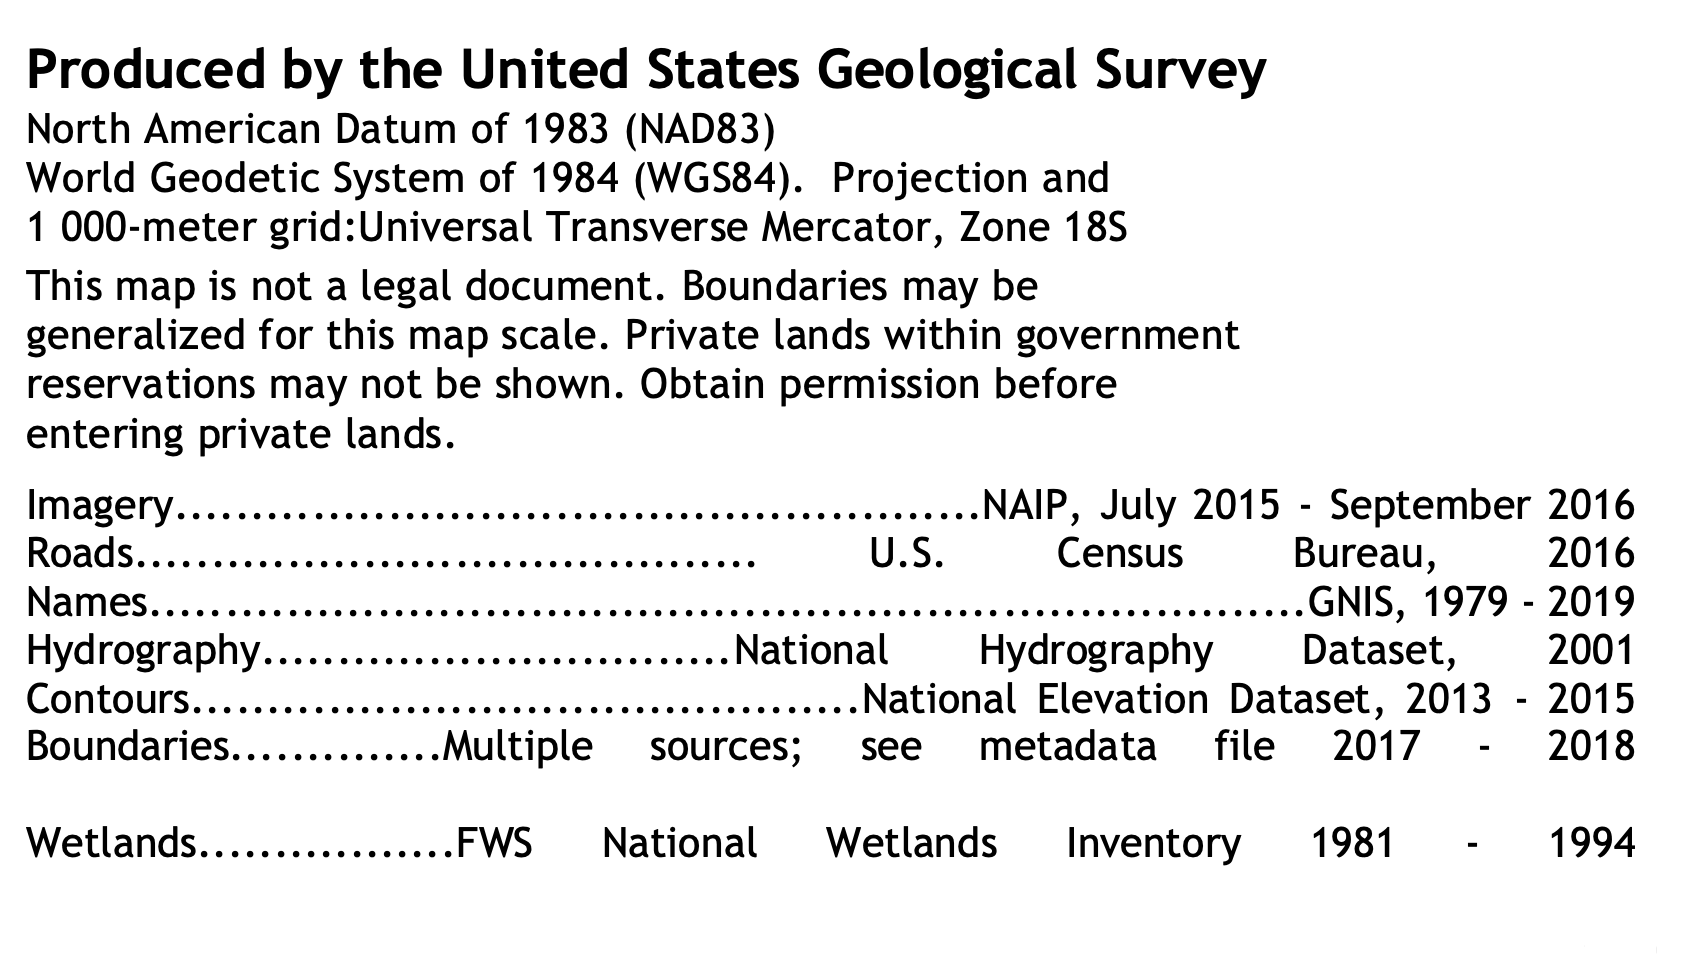
Then there’s text like this: 1 000-meter grid:Universal Transverse Mercator, Zone 18S. That’s just basic information: each grid is 1,000 square meters, it aligns with the UTM system, and it shows the USNG zone you’re viewing.
Below that shows years when each piece of information on the map was last updated. The newer, the better.
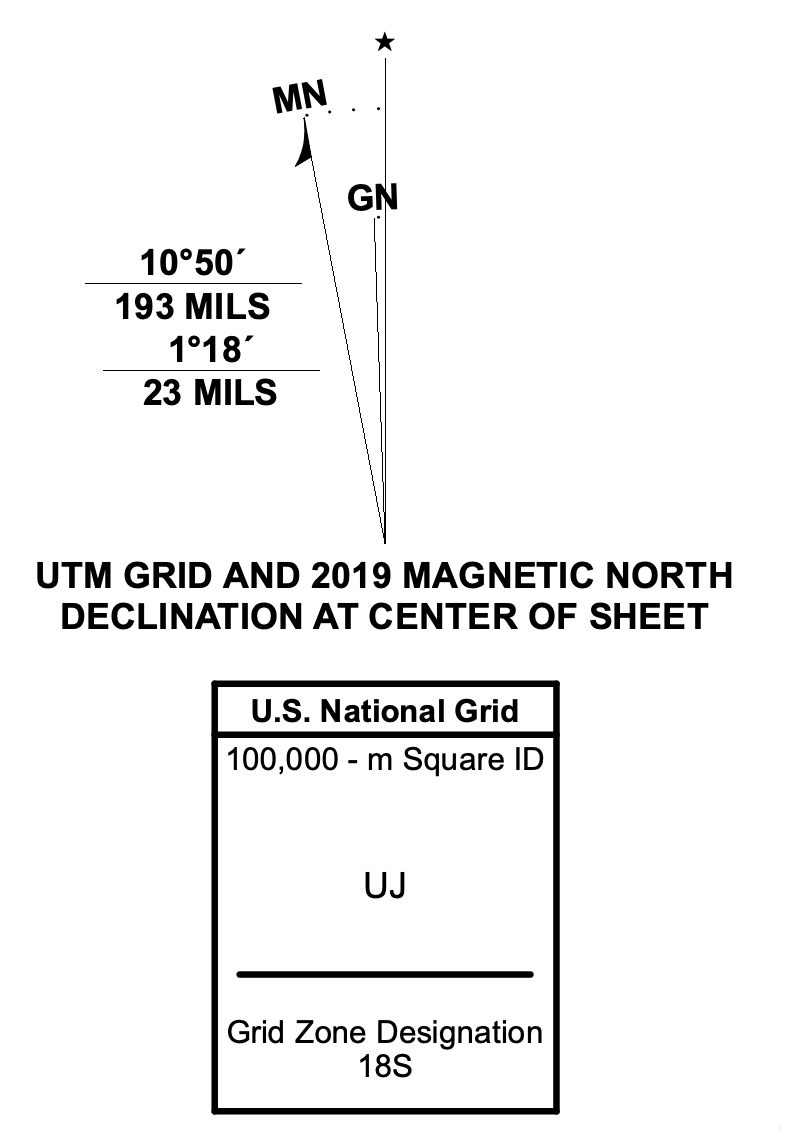
To the right of that is a declination diagram that lets you orient your compass so north on your map aligns with magnetic north. Below that is a box reminding you that the map represents 100,000 square meters, shows the two-letter regional code, and then the Grid Zone Designation. These are upside down for some reason, as they put the regional code above the GZD.
In the bottom-middle of the map is the scale chart. To the right of that is the vicinity map, which shows how your map fits into the surrounding area. Below that is the small grid that shows how that map fits in with connecting maps. Finally, on the far right is a legend that shows road information.
Finding coordinates for an arbitrary location on a USGS map
You know how to take a set of USNG coordinates and find a location on the map, but can you do the reverse? Let’s say you’re stranded in the woods but have triangulated your location with a compass and landmarks. Could you successfully communicate your position to rescuers?
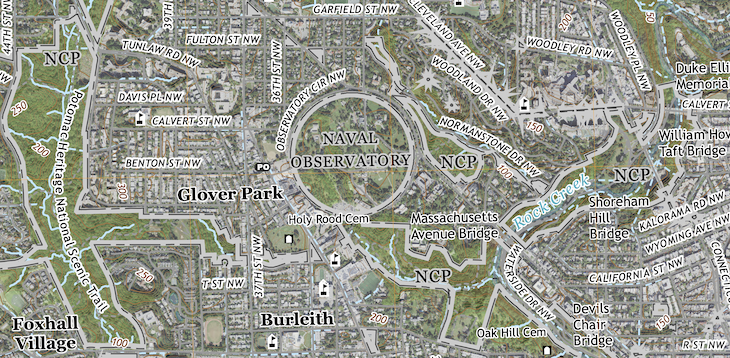
Open the map of West Washington again. Let’s use the center of the Naval Observatory as our point, since it’s big, round, and near the center of the map.
Grab a pen and paper. Look on the bottom of the map for the GZD and write it down. Then write down the two-letter region code just above it. Now we just need the easting and northing coordinates.
Remember, to find a spot on the map, you go right, then up to find the correct square to search in. So to find the coordinates for the Naval Observatory, down and then left to find the lower-left grid square corner it sits in. It sits just above 10 on the northing line and to the right of 20 on the easting line.
So now you should have a coordinate that looks like this: 18SUJ2000010000. That gets you close, but let’s dial it in a bit.
The Naval Observatory sits mostly to the right of the 20 northing meridian, with a sliver of it past 21. We’re going to guesstimate that the middle is about 70% past 20. So that updates the coordinate to 18SUJ2070010000. Don’t just copy our guess, make your own and write it down.
The Naval Observatory sits on top of the 10 northing line, so estimate the center to be about 20% above it, updating the coordinate to 18SUJ2070010200. Again, make your own guess! That should dial the location in to about a 100-meter radius.
Now check your result to see how you did. Go back to NCAT and next to “Select the type of horizontal coordinate:” select USNG. Now paste or punch in the coordinate you derived, which marks it on the map. Zoom in on the map to see exactly where it landed.
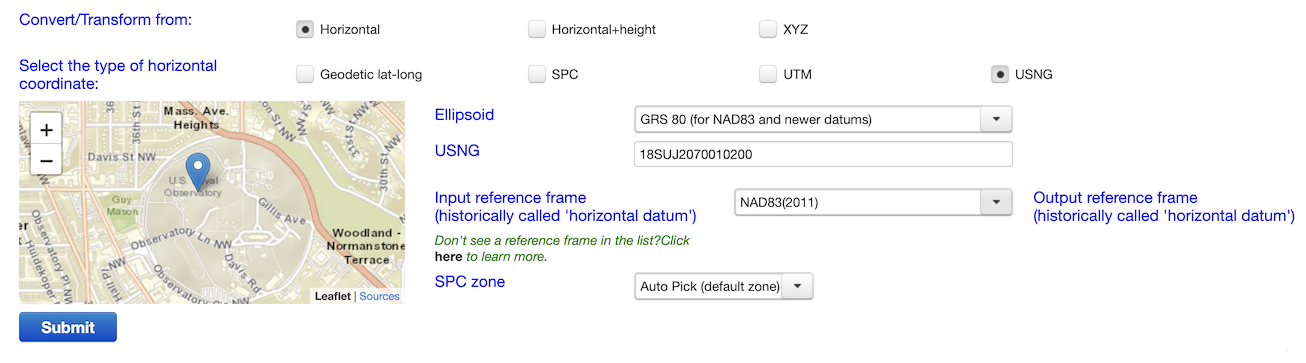
We got well inside the Naval Observatory but didn’t quite hit the center. Did you? Just like shooting a gun, it takes practice and skill to hit your mark. But the point of this exercise is to get comfortable enough with the system and with making decent estimates so that you can convey your position to a reasonable radius. A first responder would have much more to work with this coordinate than if they were searching blind.
How to read contours on a topographic map
Contour lines are important when traveling in the wilderness because they give you a sense of what the land is actually like. Let’s say you’re lost in the woods. You angulate your position on the map and identify a road two miles west of your location. You decide to take the shortest path there to expedite your rescue. You walk half a mile west only to stumble upon an impossibly steep ravine. Now what?
Oftentimes, the shortest path isn’t the quickest. If you can read the contour lines you can chart a path that keeps you on flat terrain, or at least on the same elevation so you’re not stuck trying to climb a mountain or descend into a steep valley.
Take a close look at a topographic map, like one from the USGS. You’ll see brown, squiggly lines all over. Those are the contour lines. Each contour line forms a closed loop, so if you start at one point on the contour line and follow it, you’ll eventually end up in the same spot.
To make sense of it, imagine a layer cake, where each layer is smaller in diameter than the one underneath. The outline of each layer would be a contour line.
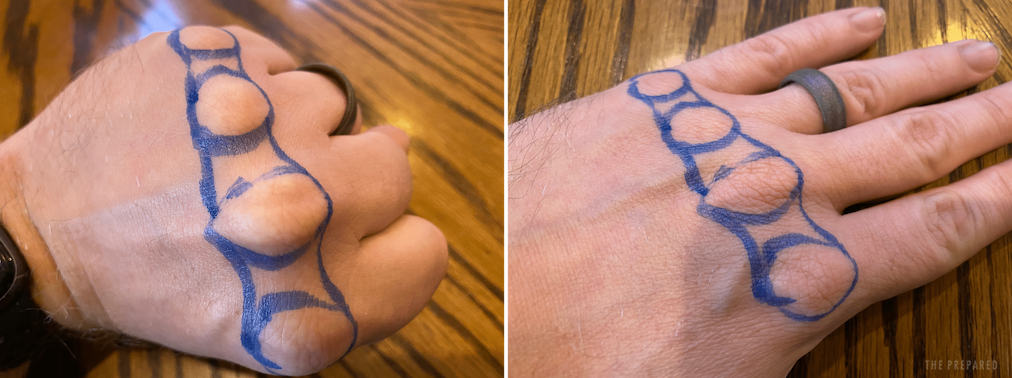
Another classic method is to draw lines on your hand with a marker. Make a fist with your non-dominant hand. Draw a circle around each knuckle. Then draw concentric circles around your fist on contour. When you’re done, open your hand and lay it flat. The lines on your hand are contour lines.
There are a few different types of contour lines on a topographic map, but the first one to know is index lines, which are thicker, and are marked with the elevation in feet. Only every fifth contour line is an index line, so how do we know the difference in elevations? If you look on your map, there should be a contour interval specified somewhere, usually 20 feet. So the space between each contour line is 20 feet or whatever your map’s interval is. (If the interval is anything other than 20 feet, you’re probably looking at especially flat or rugged terrain.)
Those lighter, unmarked contour lines are called intermediate contour lines.
The key thing to remember about contour lines is: the closer together they are, the steeper the terrain. If an area has no contour lines, that means it’s flat. Widely spaced contour lines indicate a gentle slope. When navigating, you should try to avoid crossing a space where contour lines are tightly grouped. Look at a topographic map again and try to identify flat spots, gentle slopes, and steep areas.
Relatively flat areas may have dashed contour lines called supplementary contour lines, which indicate half of the contour interval. They express mild changes in elevation.
Another rule to remember about contour lines is that they never touch or intersect, with one exception: at a vertical wall or a cave.
There are five major terrain features you can identify on topographic maps:
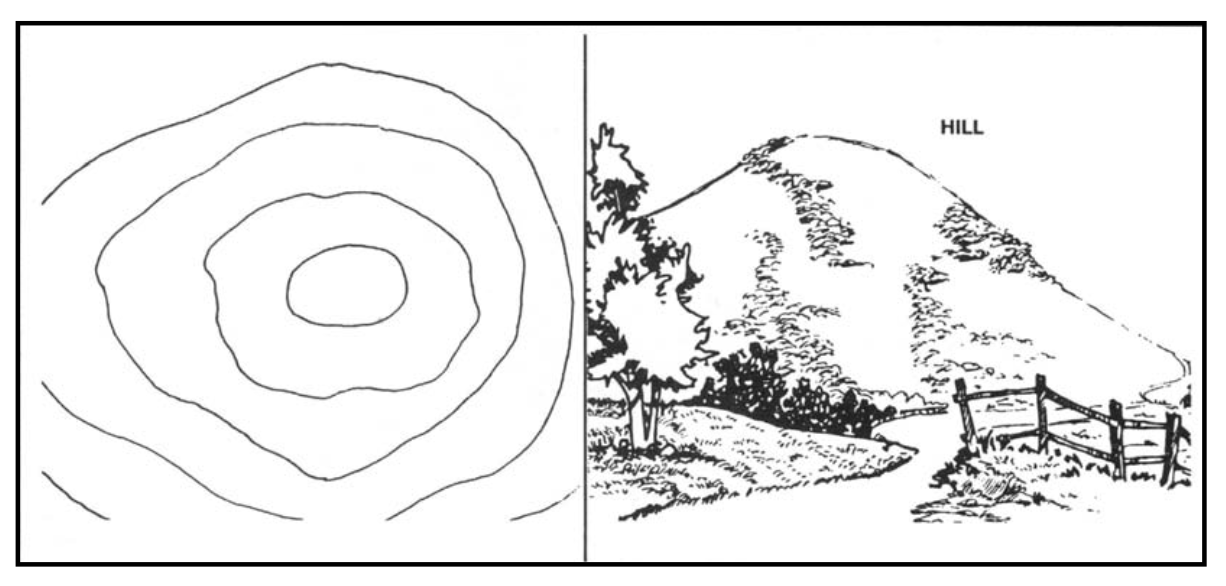
Hills: Hills are represented by concentric contour lines with a small, circular contour line in the center. They often look kind of like the concentric rings of an archery or firearm target. Sometimes the peak of a hill is marked with a symbol, like a triangle or an X.
Valleys: A valley is a long groove in the land with high ground on three sides. There is often a water source in a valley. Look for V- or U-shaped lines on the contour map. The closed point of the V or U always points to higher ground.

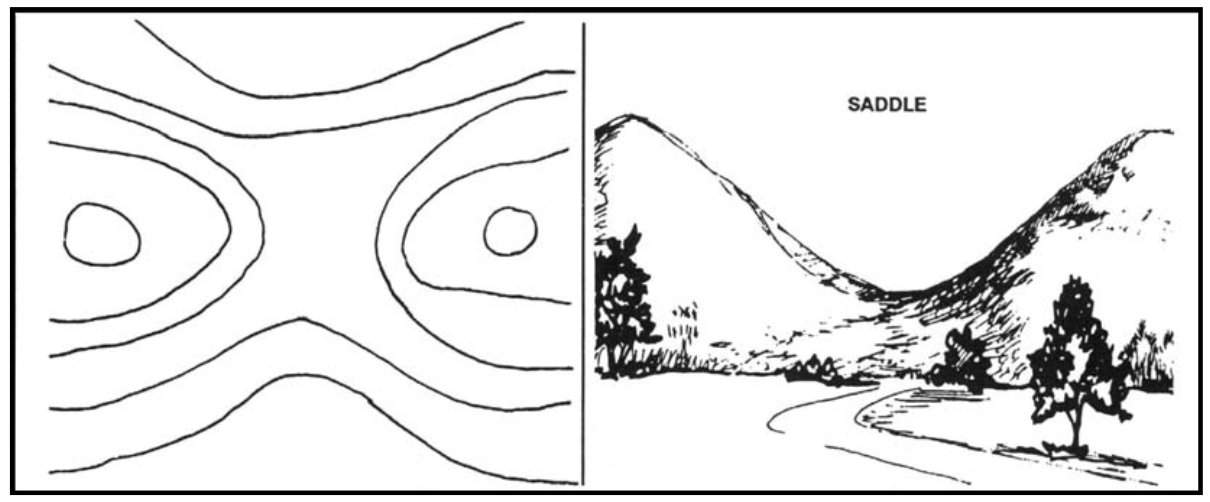
Saddles: A saddle is a low point between two high areas. Look for an hourglass shape in the contour lines.
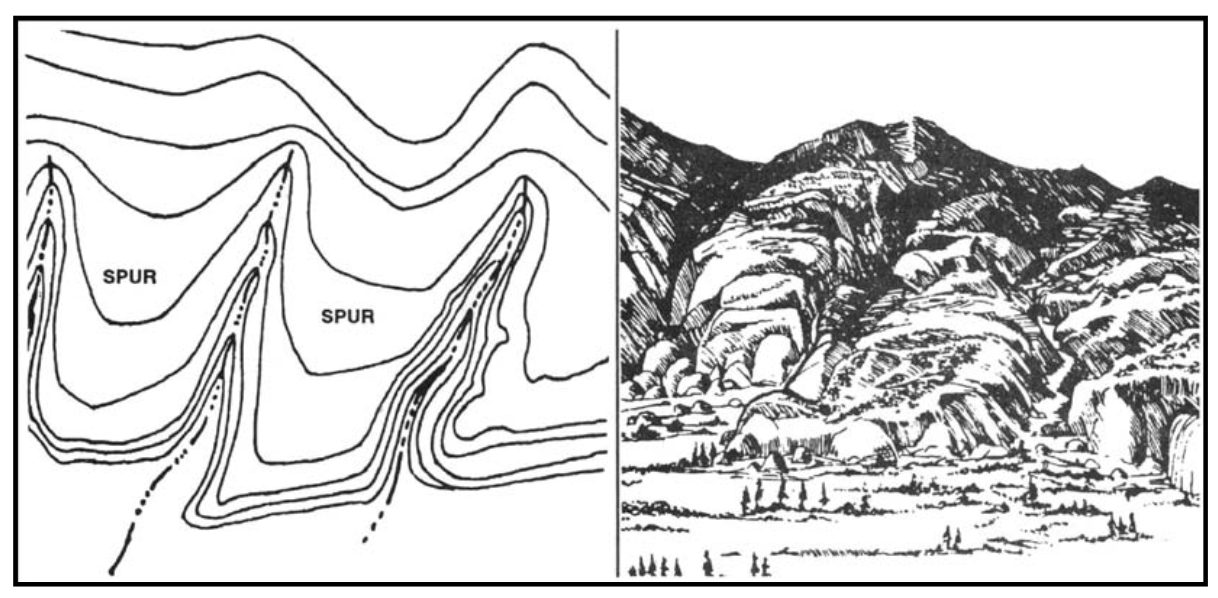
Ridges: A ridge is a sloping line of high ground. It may be represented by V- or U-shaped lines or by a series of hills connected by saddles.
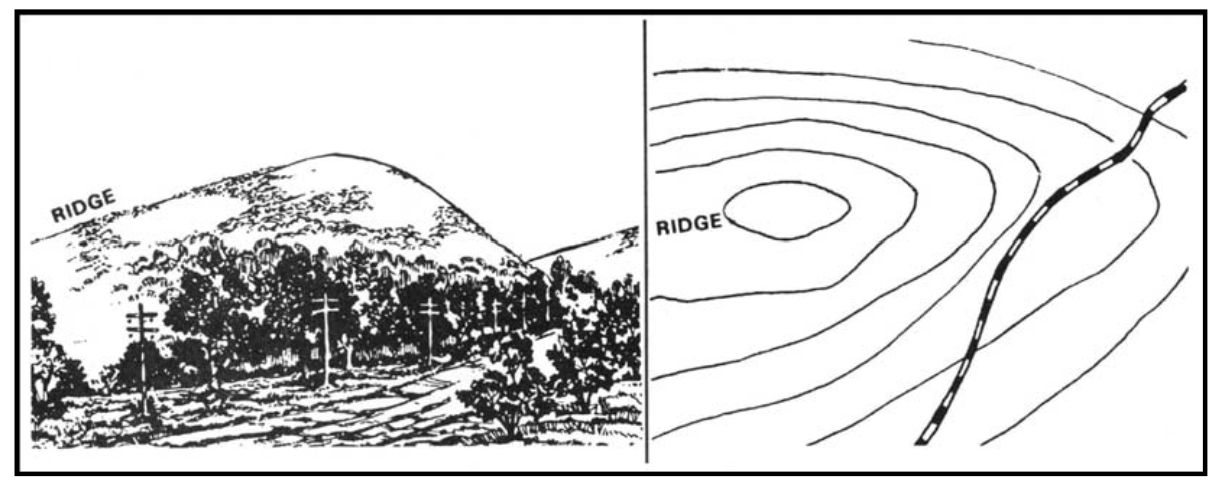
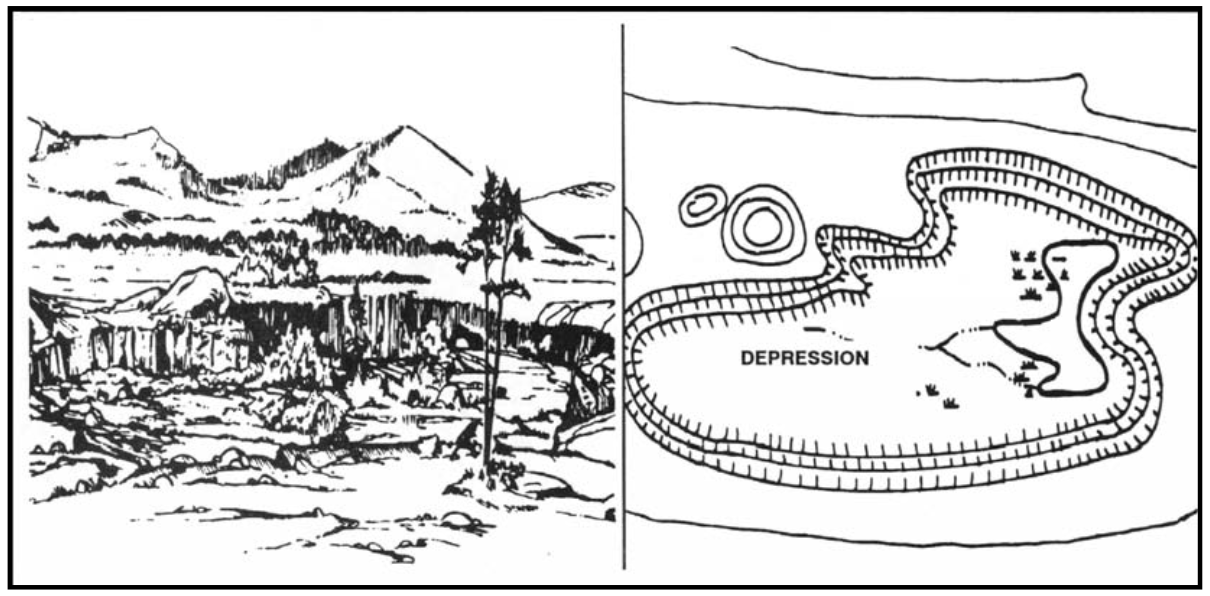
Depressions: Low points in the ground surrounded by higher ground. Contour lines for depressions are represented by tick marks intersecting the contour line.
There’s an old military pneumonic to remember these major terrain features: Hidden Valley Ranch Salad Dressing.
And there are three minor terrain features to know:
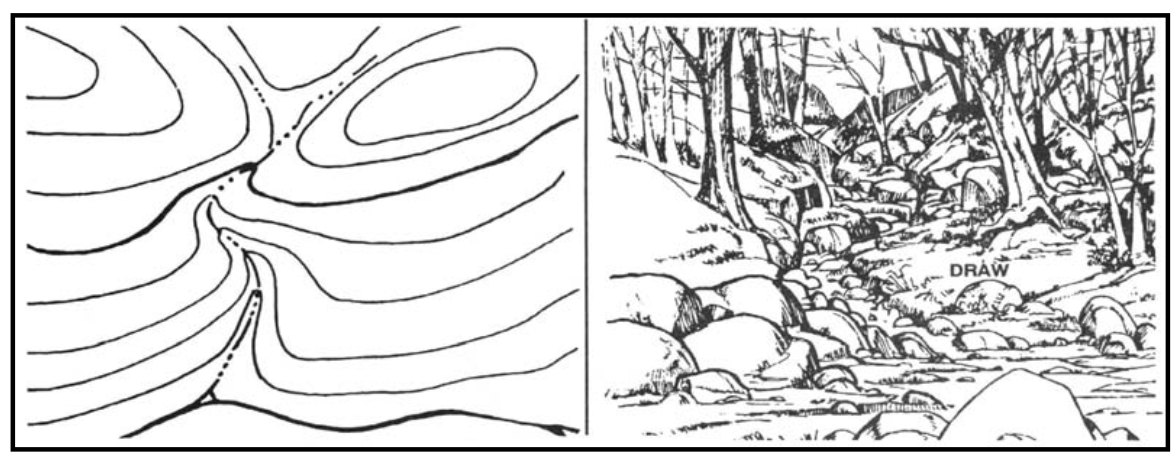
Draws: A draw is similar to a valley but has no level ground, which makes draws difficult to navigate.
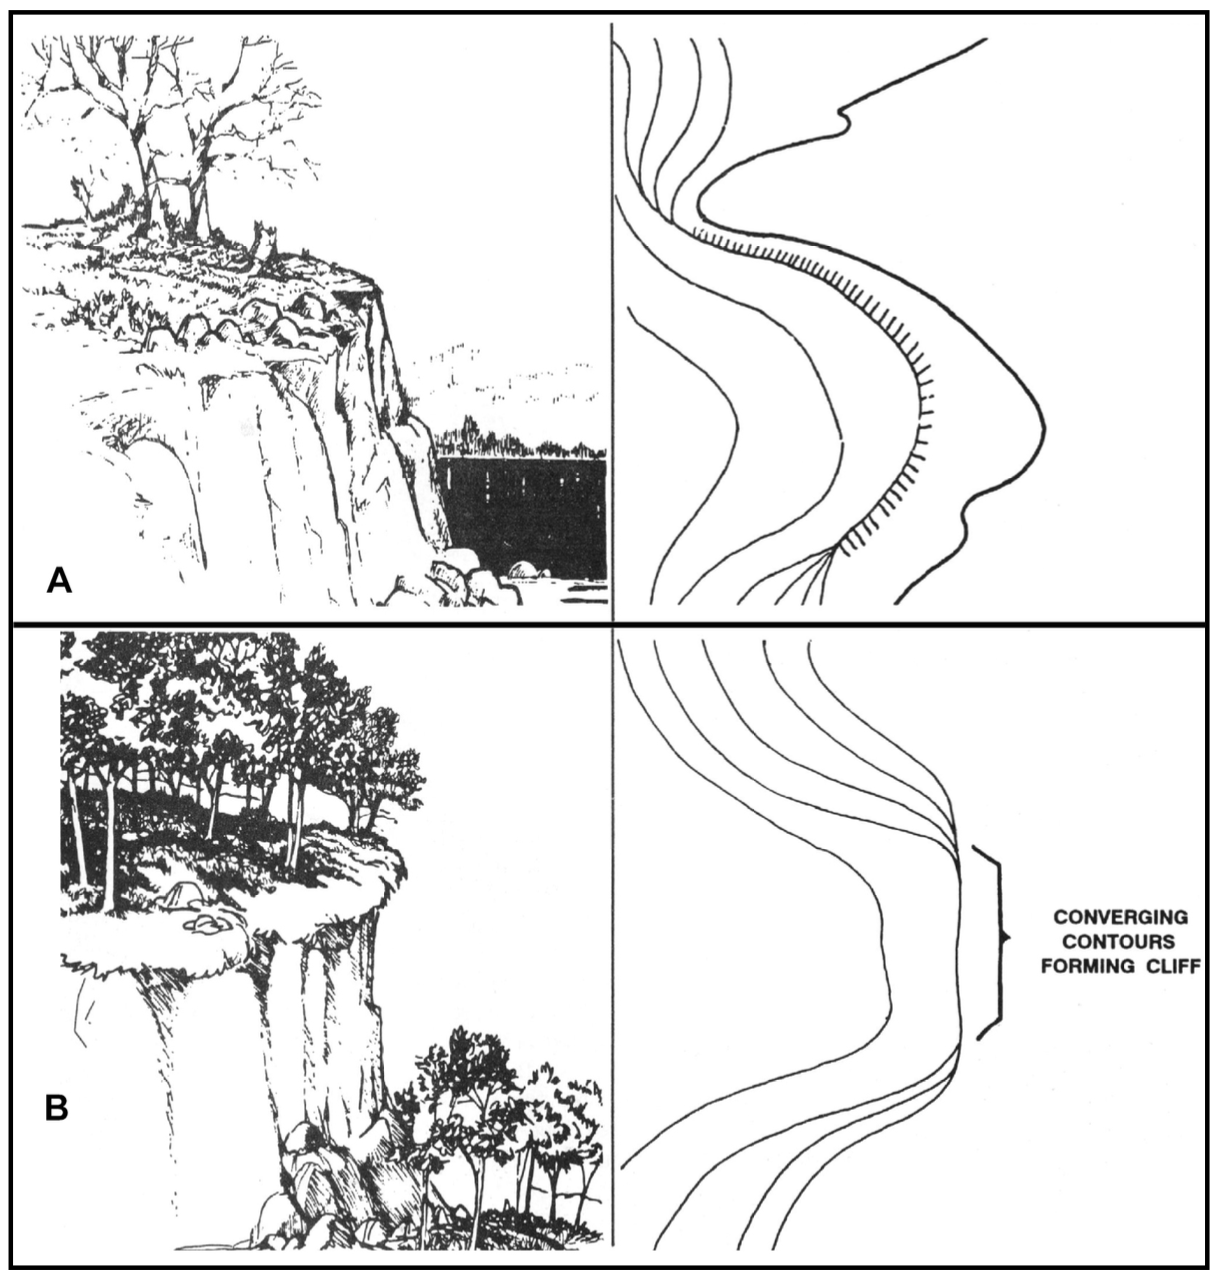
Cliffs: Cliffs are sudden drop-offs in terrain. They’re marked either by closely spaced contour lines with tick marks or by the rare occurrence of contour lines touching.
Spurs: Spurs are similar to ridges in that they’re sloping lines of high ground, but they’re shorter and usually jut out from ridges.
There are also two supplementary terrain features:
- Cuts: A cut is a man-made cut through raised ground, usually to level ground for roads or railroad tracks. Cuts are represented by contour lines along the cut with inward-pointing tick marks.
- Fills: The opposite of a cut, a fill marks where people filled in a low area, again usually for a road or railroad track. Fills are represented with outward-facing tick marks.
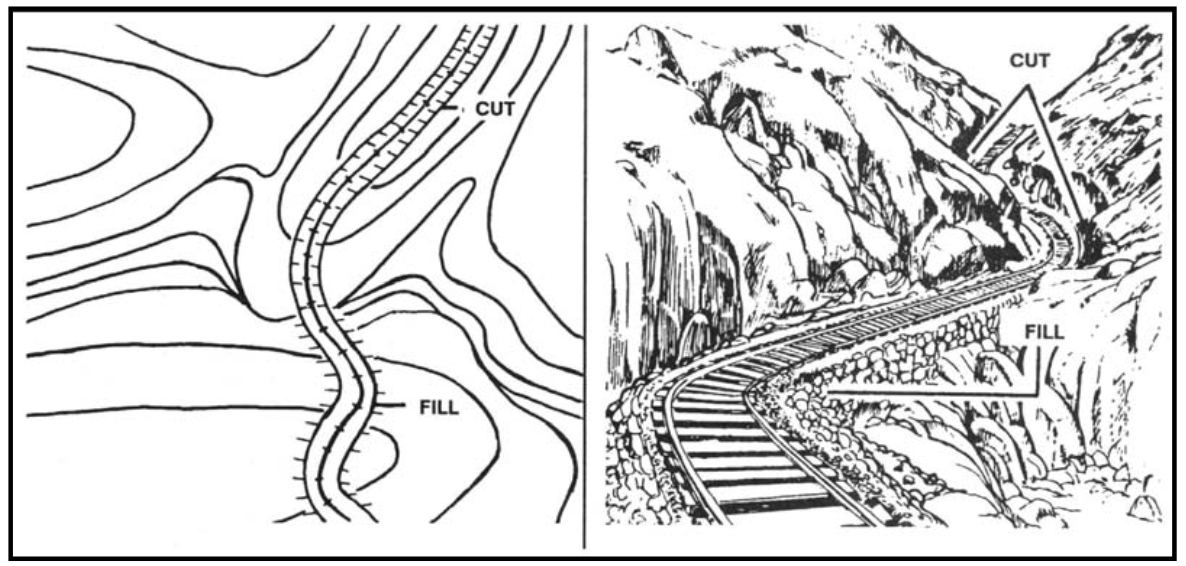
On USGS maps, cuts and fills are often represented by a red line (denoting a road) cutting through elevated terrain.
Important colors on a topographic map
Finally, there are important colors to recognize on topographic maps. You already know brown signifies contour lines. Let’s look at the others:
- Black: Man-made structures like buildings
- Blue: Water
- Green: Forests and wooded areas
- Red: Boundaries or roads
There may be other features marked on your map, but they’re not universal. Check your map’s legend. The USGS publishes a guide to their topographic symbols, which mark things like campgrounds and swamps. However, if you know how to read everything listed in this guide, you can suss out most things on a topographic map.