
A new paper published in the journal Environmental Research Letters maps the flow of food (both domestically produced and imported) between US counties, identifying nine “core counties for the US food supply” that are the most critical nodes in our food distribution network. The authors write that “a disruption to any of these counties may have ripple effects for the food supply chain of the entire country.”
We pulled the fire stats from California’s wildfire database and wrote a script to break the them out by county, and found that six of those nine core counties have seen a total 23,156 acres burn up so far in 2019. Some of the fires are still ongoing.
Above are the burned acreage totals (in hundreds of acres, or hectares) compared to the food exports in billions of kilograms.
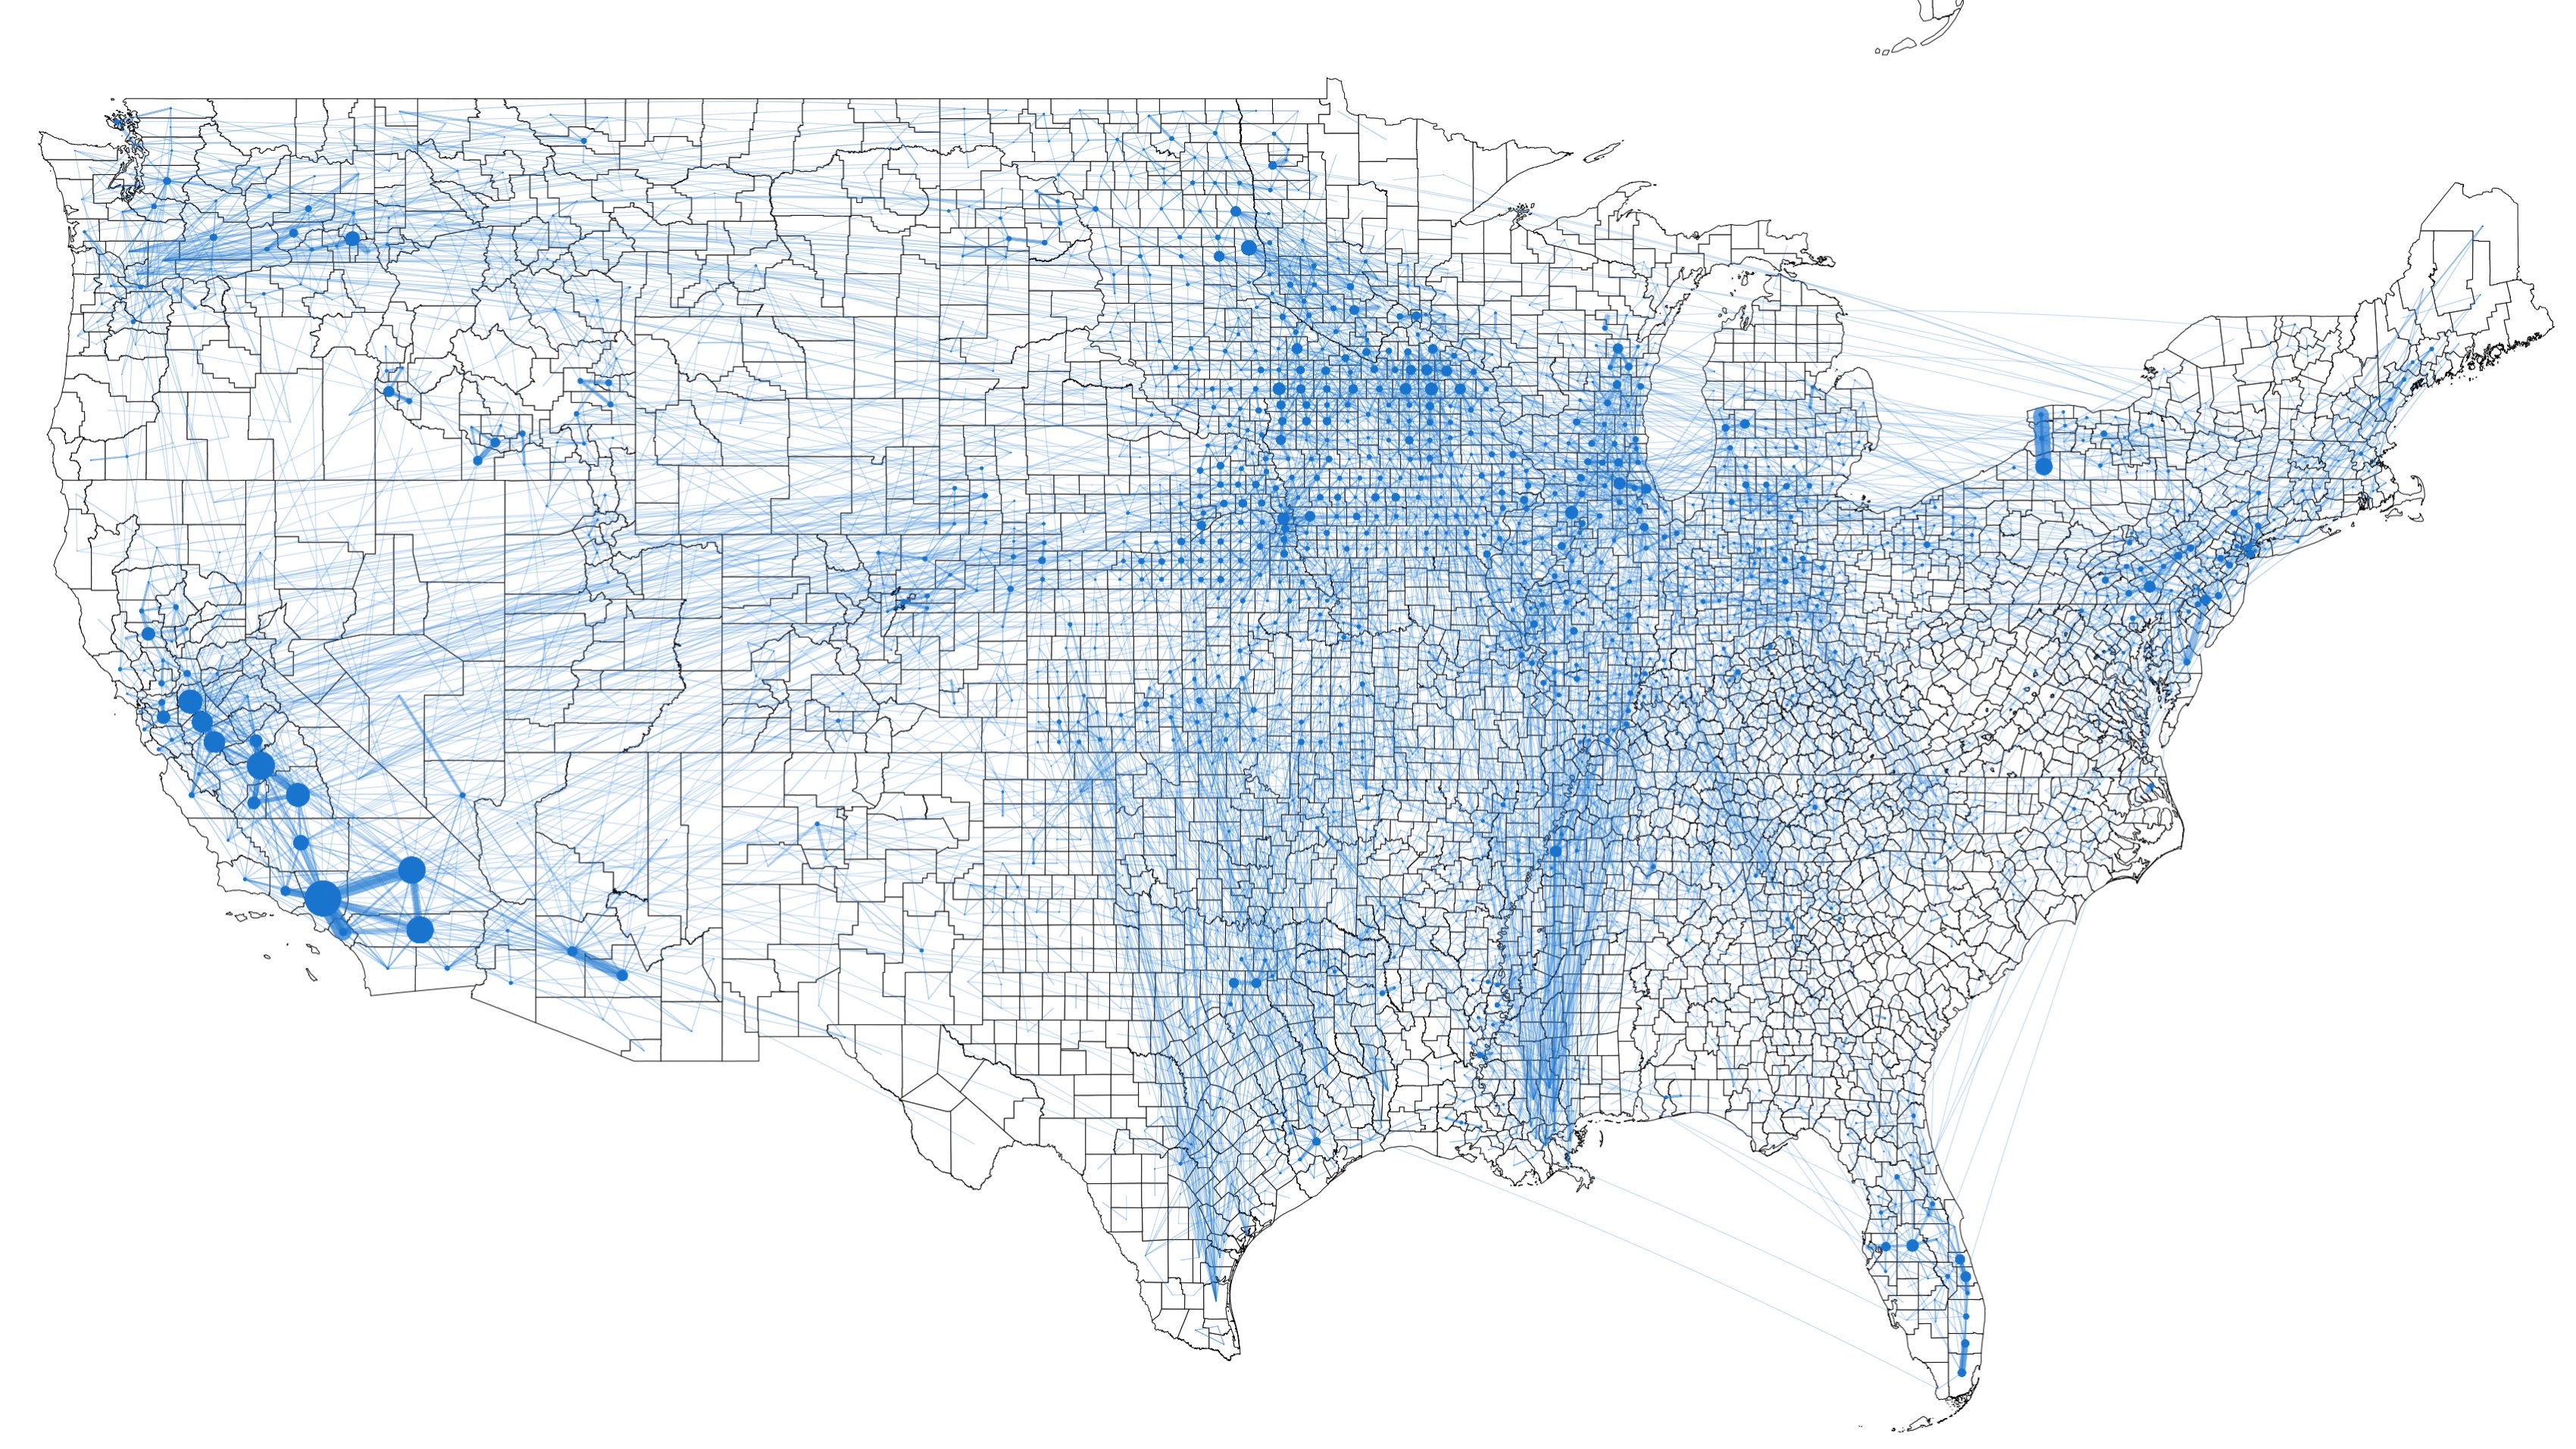
The six core counties in our chart are critical sites where food inflows and outflows to many other parts of the country converge, and you can see how connected and important they are in the network graph, below.
Even counties like Fresno and San Joaquin that have lost fewer acres so far this year have seen serious disruption from wildfire smoke alerts that keep people indoors.
Then there are the power outages. The list of core counties above is also heavily affected by the SoCal Edison planned power shutoffs. Compare the map of core food counties to the power outage map that follows it:
The danger to the food supply
The paper doesn’t get into setting thresholds for when the disruptions in these counties would get large enough to threaten our food supply. Rather, it just points out that these nine nodes in our food network represent points of failure for our entire US food supply chain.
Furthermore, these nine counties are not the only points of failure in our food system.
The food supply chain relies on a complex web of interconnected infrastructure. For example, a lot of grain produced throughout the Midwest is transported to the Port of New Orleans for export. This primarily occurs via the waterways of the Ohio and Mississippi Rivers.
The infrastructure along these waterways—such as locks 52 and 53—are critical, but have not been overhauled since their construction in 1929. They represent a serious bottleneck, slowing down innumerable supply chains nationwide, including that of grain. If they were to fail entirely, then commodity transport and supply chains would be completely disrupted.
So there are a handful of waterways, ports, and locks in the Midwest and South that are also key failure points. In fact, of the three non-California core food network counties — Shelby, TN; Maricopa, AZ; and Harris, TX — that last one contains Houston, TX, and sits right on the Gulf coast and in the line of fire every hurricane season. Harris County, then, is both an oil import hub and a food import hub, so it’s doubly critical for our national infrastructure.
It’s not clear that we’ll ever be able to know where the threshold of truly dangerous disruption is for any of these network nodes until we’ve reached it and have started to see the impact on food availability. This is part of the nature of complex systems, that they’re hard to model and can go through sudden state changes when enough highly interconnected nodes are removed.
Major export counties are also burning
If we turn from the nine critical food network nodes and look instead at what the paper identifies as the top ten counties with the largest food exports by billions of kilograms, some of the core nine are on the list, and some aren’t.
- Los Angeles County, CA: 16.6b
- Fresno County, CA: 12.4b
- Stanislaus County, CA: 9.9b
- San Bernardino County, CA: 9.8b
- San Joaquin County, CA: 8.9b
- Merced County, CA: 8.9b
- Riverside County, CA: 8.7b
- Tulare County, CA: 8.0b
- Kern County, CA: 5.8b
- Maricopa County, AZ: 5.7b
But the top ten food exporting counties has a high degree of overlap with a list we generated of the counties affected by the 2019 wildfires so far, ranked from most affected to least. The numbers are acres burned, and boldfaced counties are in the paper’s top ten food exporters.
- Sonoma: 77758.0
- Plumas: 54612.0
- Modoc: 20185.0
- Los Angeles: 13675.0
- Ventura: 11919.0
- Tehama: 10241.0
- Lassen: 7977.0
- Mariposa: 7679.0
- Riverside: 6888.0
- San Luis Obispo: 5506.0
- Mono: 4840.0
- Monterey: 3730.0
- El Dorado: 3606.0
- Stanislaus: 3478.0
- Kern: 3472.0
- Siskiyou: 2557.0
- Yolo: 2545.0
- Tulare: 1654.0
- Mexico: 1532.0
- San Diego: 1459.0
- Sutter: 1350.0
- Contra Costa: 1317.0
- State of Oregon: 1301.0
- State of Nevada: 1165.0
- Mendocino: 1068.0
- Shasta: 1040.0
- Butte: 1033.0
- Santa Clara: 859.0
- Placer: 844.0
- Santa Barbara: 720.0
- Napa: 640.0
- Alameda: 533.0
- Trinity: 524.0
- Solano: 458.0
- San Bernardino: 434.0
- San Joaquin: 417.0
- Fresno: 283.0
- Yuba: 268.0
- Madera: 213.0
- Merced: 210.0
- San Benito: 184.0
- Kings: 161.0
- Sacramento: 134.0
- Lake: 126.0
- Tuolumne: 104.0
- Calaveras: 94.0
- Marin: 67.0
- Glenn: 63.0
- San Mateo: 62.0
- Humboldt: 30.0
- Colusa: 20.0
- Santa Cruz: 10.0
- Amador: 10.0
- Nevada: 2.0
- Inyo: 0
We may not be able to predict when the fires, blackouts, and smoke will get bad enough to cause food shortages or price spikes in other parts of the country, but the results from the paper, when placed alongside the current, broken-down state of California’s public lands and power infrastructure, should have us all thinking carefully about food security — both the country’s and our own.
You are reporting the comment """ by on