Edit Nov 2022: Here’s the latest survey data from 2020.
Whenever we do mainstream press — such as this recent interview with our founder on NPR’s 1A national talk show — we’re inevitably asked to define preppers in terms of demographics like age or politics.
As TP readers know, there’s no such thing as a “stereotypical prepper,” and thankfully so. Gone are the days when this community was characterized as extremists on the edges of the bell curve.
But because this market/community is still relatively underserved and misunderstood — thanks in large part to the lack of nuance in modern media — there isn’t much in the way of dependable data about just how many of us there are and what we’re like.
During that NPR interview, we talked about our estimated range of 10-20 million preppers in the US, simply meaning people who take self-reliance seriously and go beyond the common basics like a smoke detector.
One of the listeners was Dr. Chris Ellis, a US Army Strategic Planning and Policy Program Fellow working with Cornell University. He’s been analyzing years of recent FEMA data to better understand the state of personal preparedness in America, and kindly approached us to dig deeper.
What stands out:
- This study was based on a 2018 FEMA survey of 5,000 households. 2019 data is being analyzed now.
- FEMA counted a household as self-reliant or prepped — what Ellis calls a “Resilient Citizen” — if they can survive on their own for at least 31 days. Which maps well to the 2-4 weeks we often talk about as the preparedness baseline.
- 3.8% of households were counted as a Resilient Citizen (RC) in 2017. That grew to 4.5% in 2018, then 5.2% in 2019.
- That means at least 7 million out of the 120 million households in the US are prepared.
- If we conservatively assume 1.5 adults per household, that means there are over 10 million individual American preppers. That jives with the 10-20 million number we often estimate.
- Before COVID, that means around 5% of US adults were preppers.
- Given the growth trends, that should soon be 10% of adults — if it didn’t already happen during the 2020 dumpster fire.
- 31% of preppers are women, and we believe that number is growing. (Around half of TP’s community identifies as female.)
- Preppers are more likely to live outside big cities, but the number near urban areas is larger than previously known (and we think it’s growing). The SF Bay Area is the single largest traffic source for TP, for example.
- Self-reliant folks make about 10% more income per year than the average person, but they set aside over 60% more savings for emergencies.
- Other measurements, such as education and political affiliation, are mostly the same among preppers as the general population. This means preppers don’t really skew left or right, etc.
- While 13% of the US is Black, around 6.5% of preppers are Black. However, when correcting for income, education, and where people live, racial differences are muted.
- Two groups that do report prepping more than average are Pacific peoples and those with disabilities.
Defining labels
Although most people in this community don’t even like or use the “prepper” label, that’s what has stuck with the general public and the mainstream press. So it sticks around, even while the vibe has fundamentally changed from “crazy extremist” to “normal neighbor.”
Frankly, this should all just be called “Being a Responsible Adult!” We look forward to the day this doesn’t even have a special label and we stop wasting time talking about it.
For the sake of the study, Ellis defines a Resilient Citizen as someone who can survive for 31 days or longer at home without utilities or outside help. That directly maps to the 2-4 weeks at home minimum The Prepared popularized in the modern prepping framework.
Ellis excludes state actors like members of the military and high-level politicians, who have access to 31 days or more of provisions as part of their jobs. He offers the example of the crew on the International Space Station, who are “self-sufficient” for months at a time, but as a consequence of their jobs, not by choice.
There are two more categories:
- Highly Resilient Citizens (HRCs) can survive for 90+ days
- Ultra-Highly Resilient Citizens (UHRCs) can survive for 97+ days
The gap from 90 to 97 days is kind of odd, but it’s a result of how the underlying data was collected. Even if someone had responded that they can last 180 days or 5 years, FEMA truncated all of those big numbers to 97 days… for some reason. (Why FEMA, why?!)
Most preppers go beyond the one-month minimum
You might understandably think that the majority of RCs hit that 31-day threshold and quit there. After all, that month of self-reliance is enough to cover the vast majority of emergencies.
Yet the majority of people who are prepared at all are actually prepared for more than 90 days! Out of the estimated 13 million RCs in the United States, 8.3 million are HRCs or UHRCs.
2.3% of 2018’s respondents (the latest data available when the study was written) qualified as HRCs — about 5.8 million people. Only 1% or about 2.5 million people qualify as UHRCs.
Are most preppers men?
It’s true that more men prep than women: 69% vs. 31%, as opposed to a 49% to 51% split of men vs. women in the total population.
Although we don’t have hard data, based on our experience being in this community for 20+ years, that feels like a big trend in favor of women. A decade ago, people would’ve expected something more like a 90-10 split.
The split remains the same when evaluating HRCs: 69% to 31%. But when evaluating UHRCs, the gap widens: 77% are men but only 23% are women.
How old are preppers?
The average RC is only 1-2 years older than the overall population. We could argue that you can ignore that difference entirely since we see that most people don’t start thinking about self-reliance until they become an adult living in the real world (eg. after college with a job), while the broad population average counts adults as over 18. That would make the “average prepper” a little bit older than the average human.
The median age in the 2018 census data was 47.2 while the median age of those surveyed by FEMA was 49.0. Meanwhile, the median ages of RCs, HRCs, and UHRCs respectively were 51.5, 52.4, and 53.0.
Ellis says the difference in median age between regular people and RCs is statistically significant, but the age differences between RCs, HRCs, and UHRCs are not.
Every race cares about self-reliance
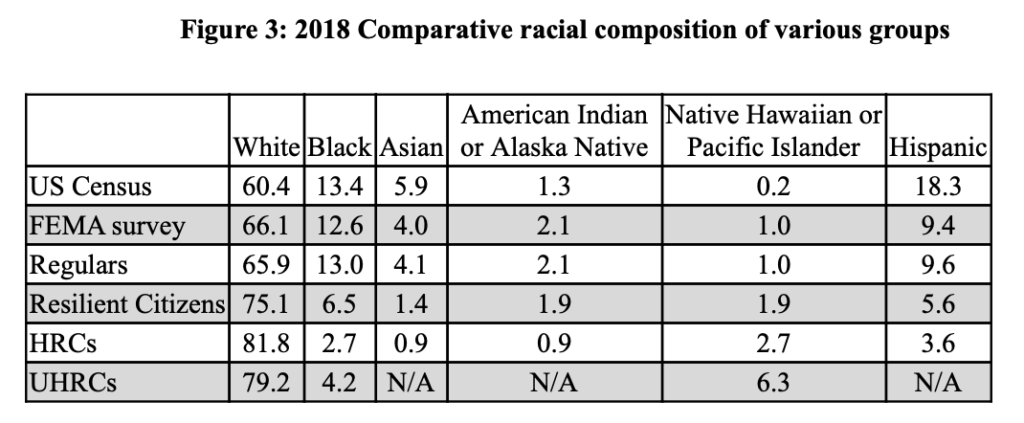
Like the overall population, whites comprise the majority of RCs, but only by about 9% more than the overall number of white respondents in FEMA’s 2018 survey. Among RCs, 6.5% were black, 1.4% were Asian, 1.9% were American Indian or Alaska Native, and 1.9% were Native Hawaiian or Pacific Islanders (NH/PI).
Whites were most overrepresented in the HRC group, making up 81.8%.
The Hispanic numbers are a bit thornier since FEMA asked a different set of demographic questions of that group. But Ellis estimates that Hispanics represent a minimum of 5.6% of the RC population.
8.8% of RCs did not speak English as their primary language, and a third of that group was from Puerto Rico.
Something that jumped out to us was the high ratio of native peoples in the Pacific. While NH/PI only represented 1.0% of the FEMA respondents, they represented 1.9% of RCs, 2.7% of HRCs, and 6.3% of UHRCs. And that’s across different states of residence, education levels, and incomes. This may be due to a small sampling size from this population. It’ll take a couple more years of data to be sure of this finding.
You don’t often imagine Hawaii or Guam as prepper paradises — but it makes sense as soon as you think about it, since they are in some of the most remote areas on earth, susceptible to natural disasters, supply chain disruptions, etc.
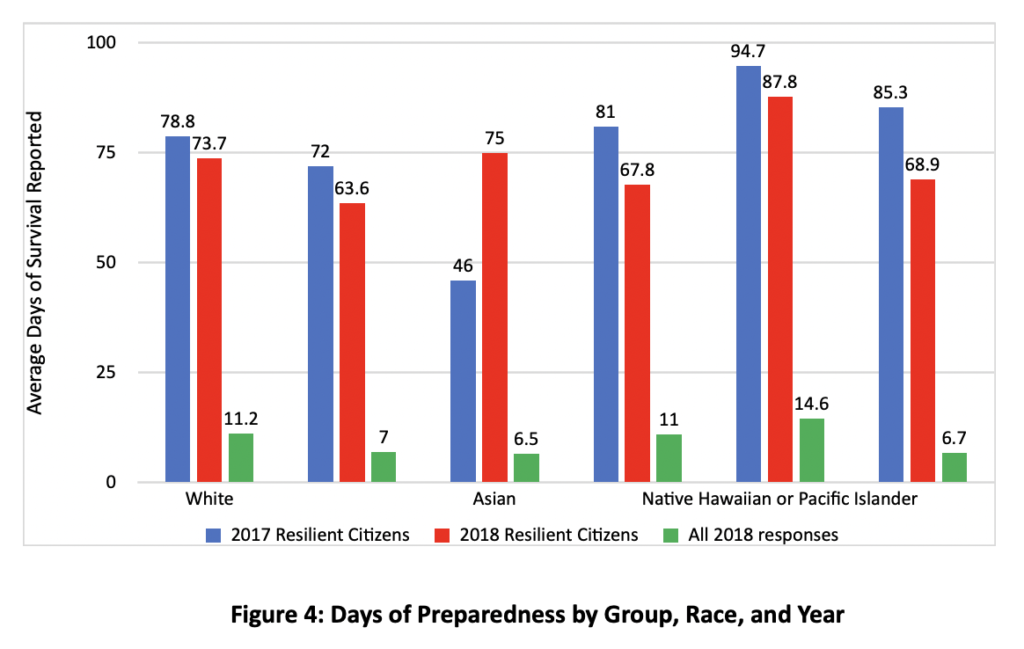
Also interesting is that all races except Asians had fewer days of preparedness in 2018 than in 2017. We’ll be curious to see how that changes once the 2020 data rolls in.
Are Resilient Citizens able-bodied?
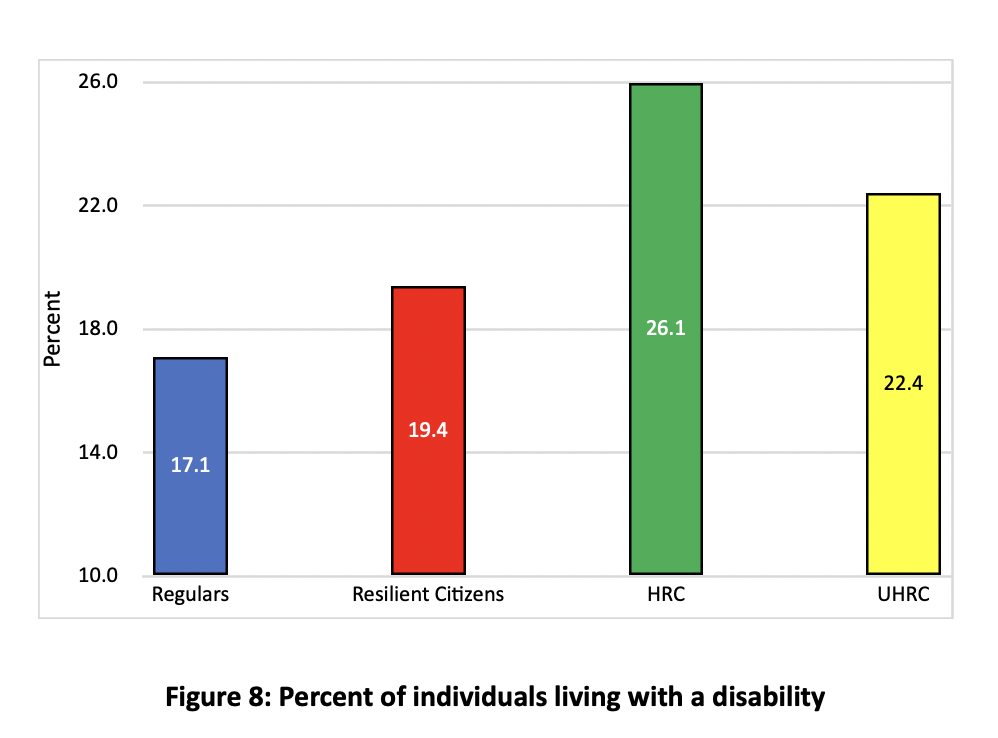
More RCs live with disabilities than the general population. While only 17.1% of unprepared people surveyed reported a disability, 19.4% of RCs reported one. Surprisingly, that number shot up in more-prepared groups: 26.1% of HRCs and 22.4% of UHRCs reported living with disabilities.
Again, it seems logical when you think through it. People with disabilities don’t need to be convinced the world can be a tough place. If disabled, even basic emergencies become much harder to deal with than for the able-bodied.
For example, a few years ago we consulted with a New York City borough that still plans on evacuating their disabled citizens using police horses because they don’t have any better way to handle it.
Education
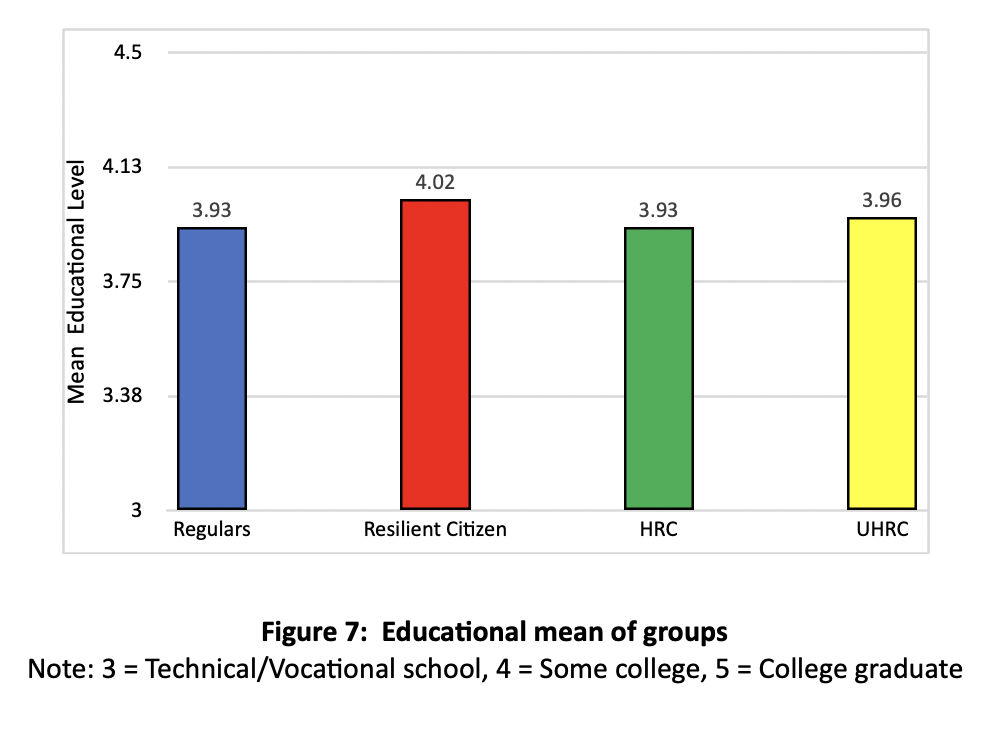
The FEMA data shows that ordinary citizens and RCs have similar education levels:
- 90% of respondents had a high school diploma, as do 90% of RCs.
- 44% had a bachelor’s degree or higher, while 42% of RCs do.
The FEMA respondents skewed slightly more educated than the general population, eg. 90% of those surveyed had a high school diploma while 88% of the general population does. So, if anything, preppers tend to be more educated than normal. Which isn’t surprising, since it takes a level of awareness about the world to see just how fragile it truly is.
Wealth
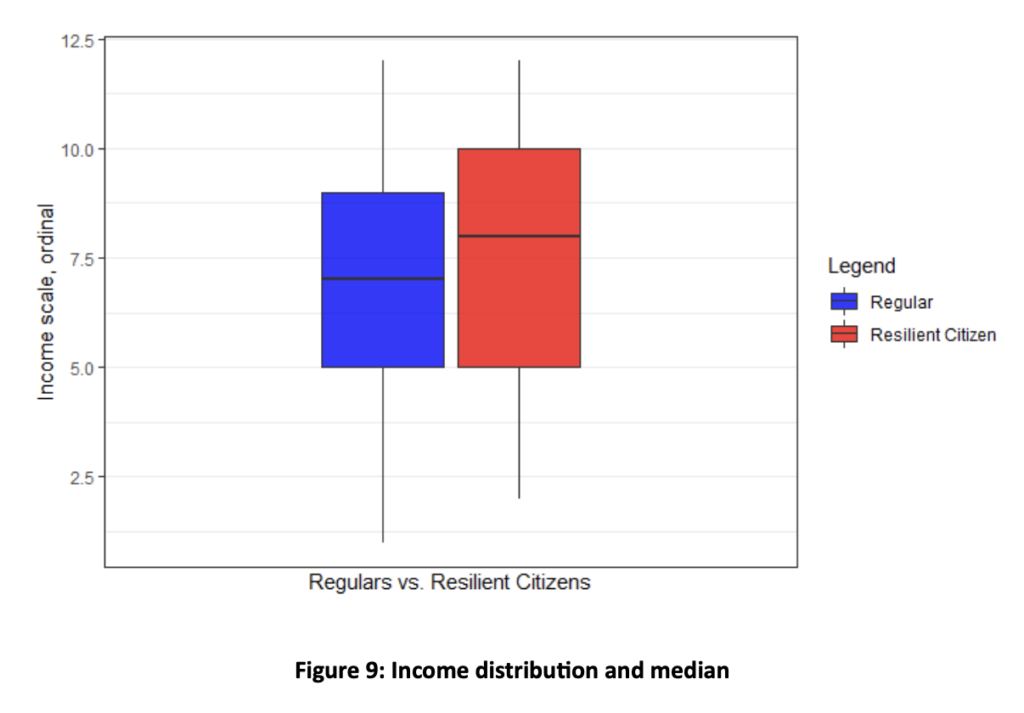
RCs and regular citizens make about the same amount of money, but use it in very different ways.
- RCs reported a mean income of $54,000 per year while regulars reported $48,000 per year.
- Meanwhile, the average US household income in 2018 was $60,000, so the FEMA sample had a lower income than the rest of the country.
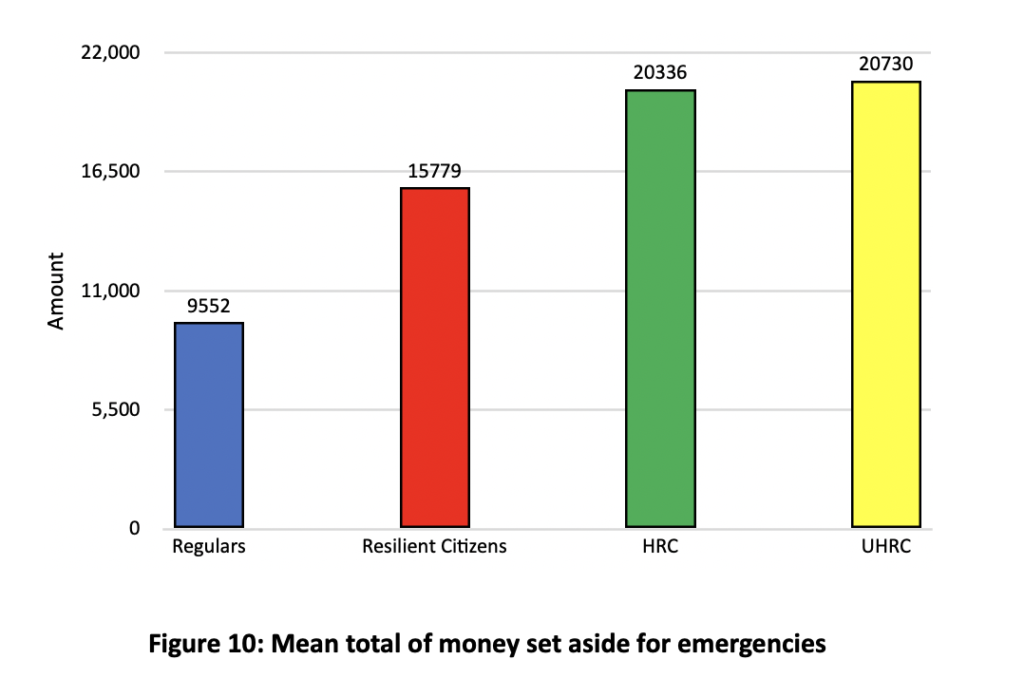
However, RCs save much more money than regular people. When asked if they set aside money for emergencies, 67.9% of regular people said yes compared to 81.5% of RCs. And there’s a big difference in the amounts saved between the different groups:
- Typical: $9,552
- RCs: $15,779
- HRCs: $20,336
- UHRCs: $20,730
As a note, nearly 40% of respondents did not respond to income questions, so it’s possible that this data is somewhat skewed. Wealthy individuals are known to be especially secretive about their income.
RCs and HRCs are nearly 7% more likely to maintain homeowners or renters insurance than regular people, and UHRCs are 12.5% more likely to maintain such a policy.
Rural vs urban
The common stereotype about preppers is that they live in the woods, separated from the rest of humanity. However, the data doesn’t show this.
78% of all FEMA respondents resided in cities or suburbs and the numbers for prepared groups were similar:
- RCs: 63%
- HRCs: 53%
- UHRC: 49%
However, notice that the percentage goes down as days prepared goes up. This seems logical because people in rural areas already know they are more likely to have longer emergencies — if there’s a major power outage, for example, the city customers are going to be taken care of first.
Ellis also pointed out some flaws in the geographical data calculated by the government. For example, downtown Los Angeles is counted the same as Missoula, Montana.
Politics
Another common stereotype is that preppers are hard-line conservatives who hate the government and society. We anecdotally know this is totally false. But it’s harder to answer in data because FEMA didn’t ask for party affiliations.
However, FEMA did catalog which states the respondents lived in. So Ellis cross-referenced the locations of RCs against the 2016 electoral map, and he found no statistical difference in whether RCs lived in a Clinton state or a Trump state.
Of course, that isn’t a perfect model. Deeply blue states like California still had millions of Trump voters. Likewise, deeply red states like Tennessee had millions of Clinton voters. And many who typically vote Republican voted for Clinton.
However, putting all of this data together shows that preppers are more of a cross-section of the American public than previously thought.
Doctor Ellis completed his work at Cornell University this summer and is now headed to INDOPACOM in Hawaii. You can follow him on Twitter @Prep4Disasters.

You are reporting the comment """ by on