Human disaster probability by zip code?
What resources are there for determining the likelihood of human disasters such as riots, prison breaks, urban fires, or chemical spills by narrow geographical area (zip code or similar scope) in the US?
I’ve found Fema’s National Risk Index which has great information but it only includes natural disasters.
-
Comments (10)
-
 Colorado Jones
- January 1, 2022
Colorado Jones
- January 1, 2022
Thanks for sharing! The FEMA risk index is very informative.
-
hikermor
- January 1, 2022
Note that Boulder, CO, had a fairly low rating, and look what just occurred there. i suspect a social index would be even more imprecise
-
Colorado Jones
- January 1, 2022
Agreed. Closer inspection of the index suggests that, as you’ve already pointed out, it underestimates both the potential for wind and wildfire events. As Boulder is notoriously windy, that seems like an oversight. Additionally, the City of Boulder and much of Boulder County are prone to flash flooding, potentially much worse than what took place during the “500 Year Flood” of 2013. Yet, oddly, FEMA’s index doesn’t even seem to have a category to rank flash flooding. While the index is a good starting point for thinking about potential disasters, it’s maybe not as comprehensive or accurate as one would like it to be.
-
C. Ross
- January 1, 2022
Absolutely, the unusual things do happen, but it is helpful to know what’s most likely.
-
-
Pops
- January 2, 2022
The other problem is the NRI scores are based foremost on dollar loss potential, then population, demographics, socio-economic status. So for example, the Bronx New York has a higher risk score from tornados @ 65, than does Norman Oklahoma @ 25.
Because there is greater potential dollar loss and more people, but also more minorities with customs and language barriers, more poverty, unemployment, maybe higher rent to own percentage in the Bronx and lower social cohesion. I would describe it as trying to gauge “societal” resilience, which is totally valid when considering the aftermath of whatever event.
On the individual level not so much, ie: building a tornado shelter in the Bronx is maybe not the best use of funds even though the NRI for tornadoes there is high. In Norman everyone has a bunker or wishes they did.
Still there is info there if you keep the above in mind. The Bronx has a social vulnerability score of 93.9, meaning it is less able than 99.9 percent of the counties in the whole country to plan, respond and recover. I’d call that BOB territory! PBO in fact (Preemptive Bug Out).
Here is a page that links to 3 of the databases the NRI combines plus one other.
NAPSG Foundation -
Forager
- January 2, 2022
I don’t know of any such resource, though I think you could slowly put your own together by looking at underlying factors. Zip codes with high population density and high poverty are probably more likely to see riots, industrial areas are more likely to see chemical spills, older buildings may not meet modern standards for fire safety, et cetera. Of course if you’re trying to compare a lot of different zip codes, it would get time consuming doing so much research.
The FEMA index seems a bit confused to me. It claims landslides are a bigger risk to my county than things like ice storms and tornadoes that we actually get every year. I’ve never heard of a landslide happening around here, and even if it did, the hills just aren’t big enough to produce town-burying landslides. Also the only sizeable town is in a flat area. If a small landslide happened in the hilliest parts of the county, the chance of even a single house being in it’s path would be fairly low.
-
hikermor
- January 2, 2022
You don’t need the FEMA chart to prepare for disasters that might affect you. I am in southern California, so it is prudent to be ready for earthquakes…same with fires.
It is no surprise that the risk for tsunamis is low in Illinois, as well as Iowa and Wisconsin. No FEMA chart necessary for those revelations…..
-
-
Seasons4
- January 3, 2022
Counties in the U.S. may have hazard mitigation plans. It’s not Zip code specific, but it’s helpful information. You might check with the county emergency management department or check with the county board of supervisors.
Here’s a sample. In this example, the non-natural hazard types, descriptions, and mitigation strategies are from a 2016 plan. The county didn’t update the non-natural hazards for the current plan because a state agency didn’t complete its work on time, as I understand it. The 2016 info was included as an appendix in the current plan so that the work wouldn’t be lost and could serve as a starting point in the future. The non-natural hazards are in appendix C.
-
Gideon ParkerStaff
- January 3, 2022
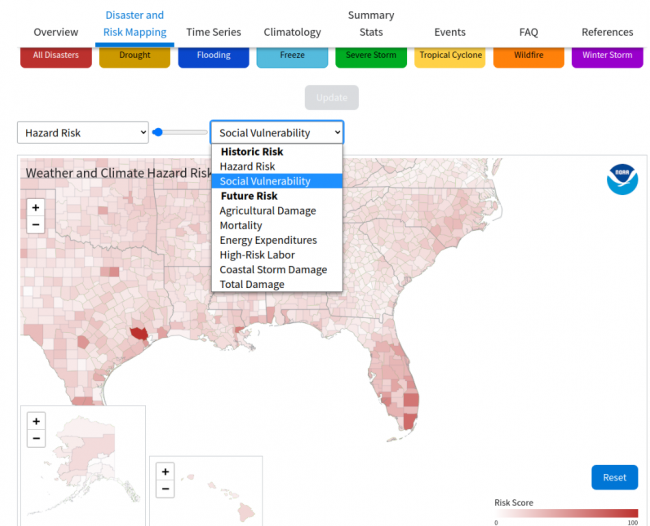
One of our staff members recently told me about the NOAA disaster risk mapping tool. It’s more of a natural disaster tool on a county level but still a valuable resource to look into.

-
Noah Prepares
- January 19, 2022
Here is a link to the scientific paper explaining how community resilience was calculated. It is interesting to see what factors were considered.
https://www.sciencedirect.com/science/article/pii/S0959378014001459
-
- Whats going on with this site - 2 months ago
- Mylar Bags - February 27, 2026
- Shot Show 2026 recap - January 22, 2026
- News for the Week 2026-1-12 - January 12, 2026
- News for the Week 2026-01-05 - January 5, 2026
This forum is heavily moderated to keep things valuable to as many people as possible. Full community policies are here. The basics:
- 1. Be nice to each other.
- 2. Stay focused on prepping.
- 3. Avoid politics, religion, and other arguments.
- 4. No unfounded conspiracies, fake news, etc.
- 5. Debate ideas, not people.